Open Access
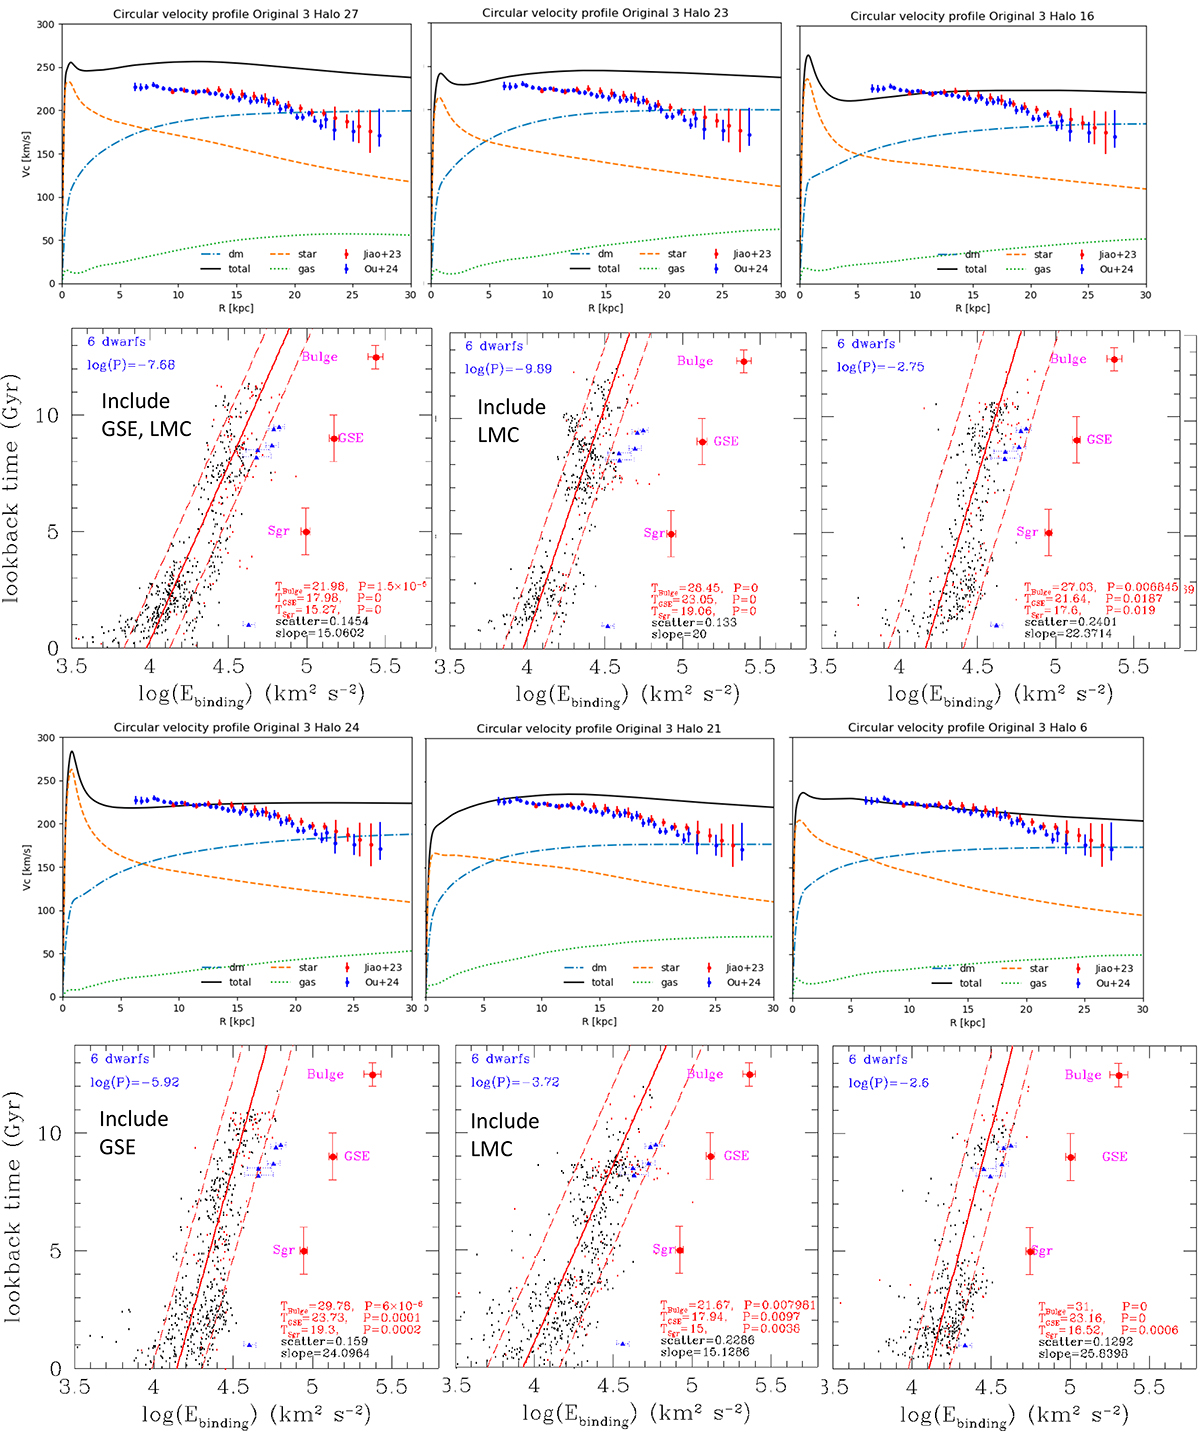
Fig. B.4.
Download original image
Rotation curves (top) and accretion history (bottom) from high MW-mass galaxies from Auriga. Same symbols for points and lines than in Figure B.3. Some Auriga simulations have been considered to be representative of the infall of GSE or of the LMC, which is indicated in the bottom panel of the corresponding simulations.
Current usage metrics show cumulative count of Article Views (full-text article views including HTML views, PDF and ePub downloads, according to the available data) and Abstracts Views on Vision4Press platform.
Data correspond to usage on the plateform after 2015. The current usage metrics is available 48-96 hours after online publication and is updated daily on week days.
Initial download of the metrics may take a while.