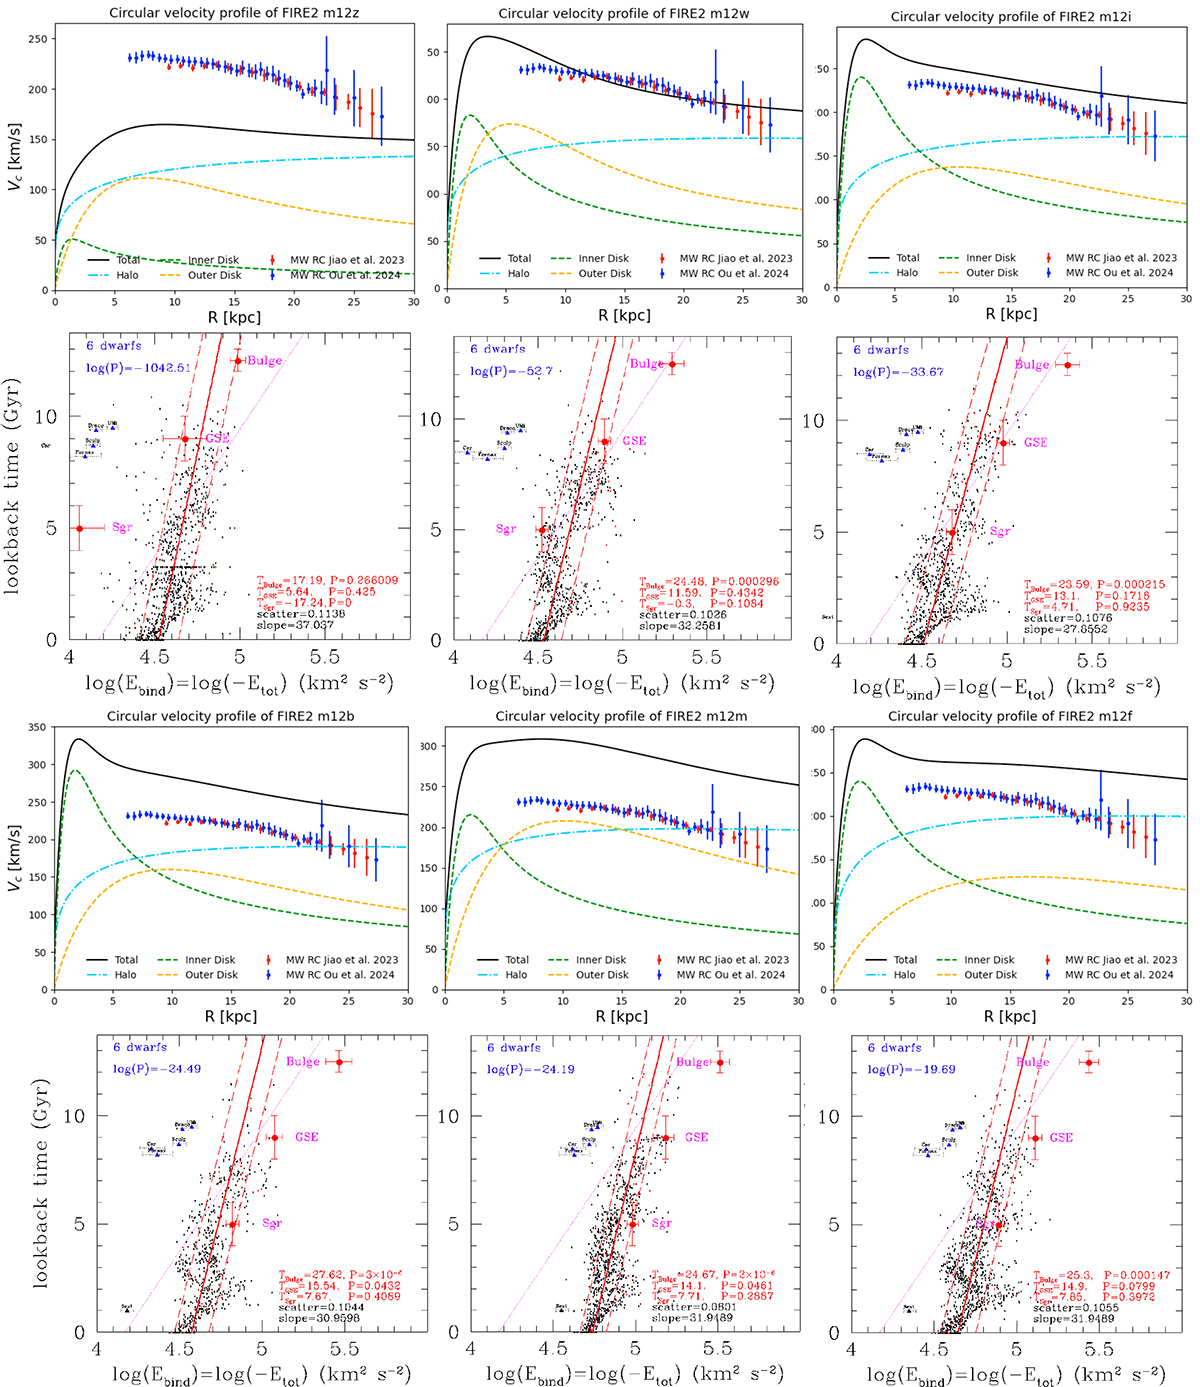
Fig. B.3.
Download original image
Rotation curves (top panels) and accretion history (bottom panels) from isolated MW-mass galaxies from FIRE. Same symbols for points and lines than in Figure 2. For simplicity, here we have only show the six classical dwarfs (blue triangles) and bulge, GSE and Sgr GCs (red crosses). The top (bottom) panels include simulated galaxies with total mass M200c smaller (higher) than .
Current usage metrics show cumulative count of Article Views (full-text article views including HTML views, PDF and ePub downloads, according to the available data) and Abstracts Views on Vision4Press platform.
Data correspond to usage on the plateform after 2015. The current usage metrics is available 48-96 hours after online publication and is updated daily on week days.
Initial download of the metrics may take a while.