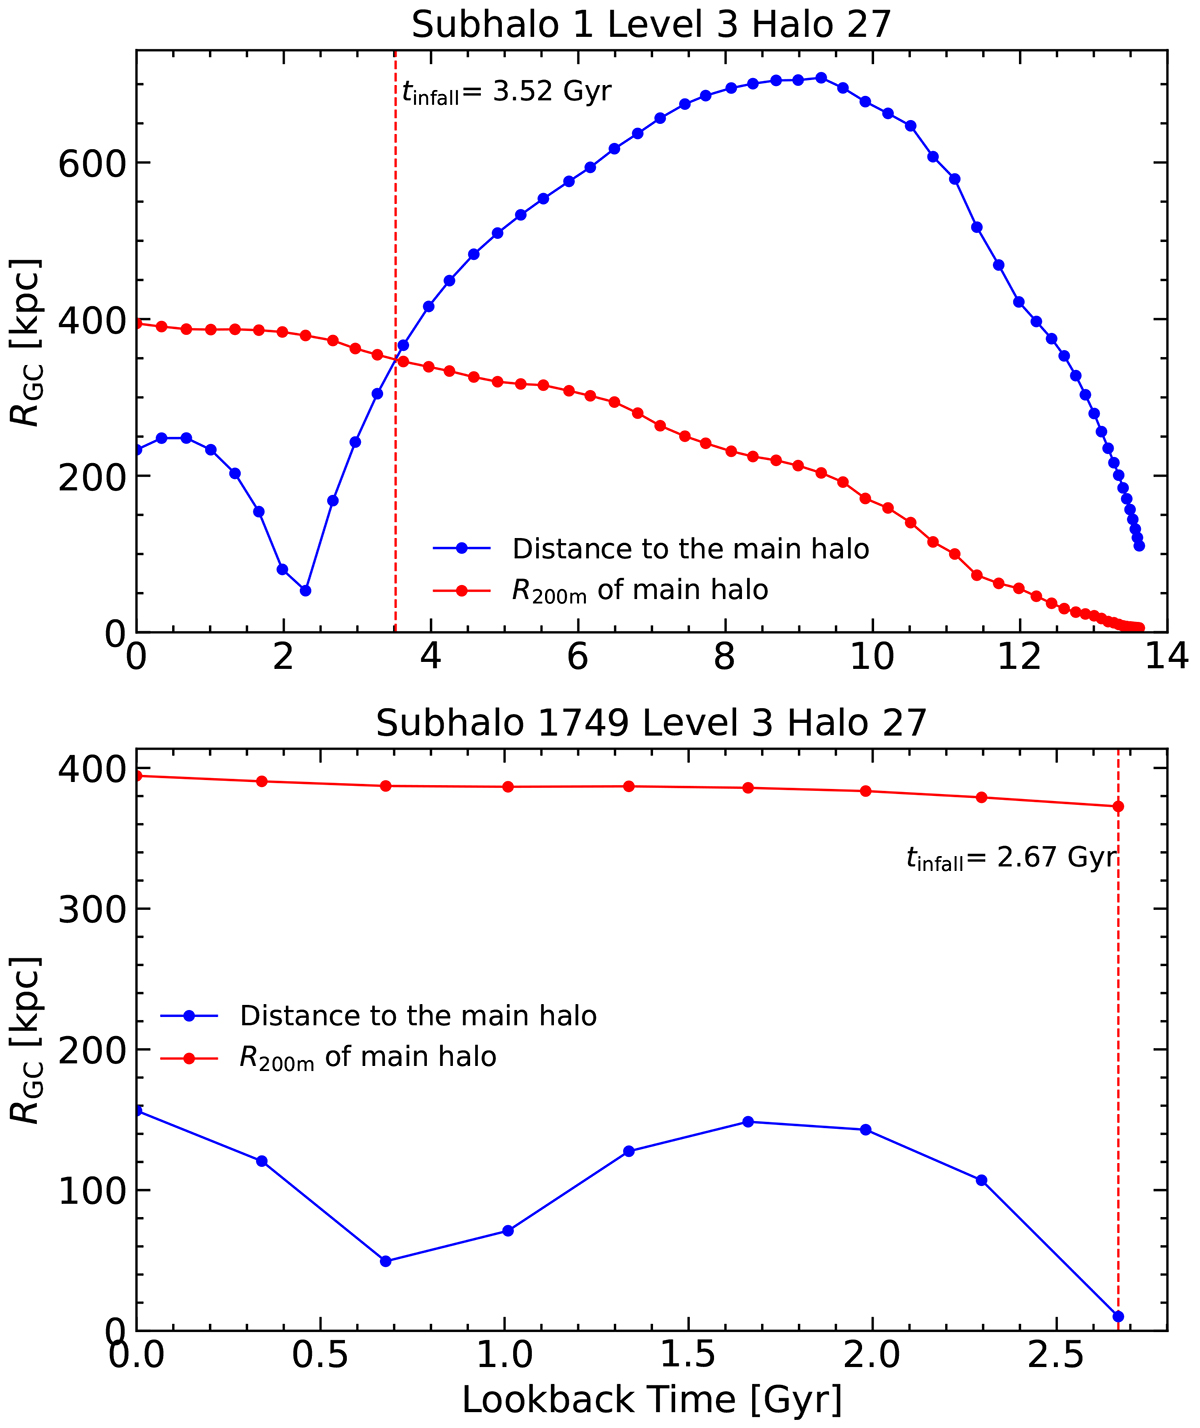
Fig. B.2.
Download original image
Example of calculation of infall time for Auriga simulations. Blue points and dash lines indicate the distance of subhalos 1 (top panel) and 1749 (bottom) from Auriga MW-like Level 3 resolution Halo 27 to the main host galaxy center. Red points and lines indicate the evolution of the virial radius (R200m) of the main host galaxy at different epochs using the linear relation in Fig B.1. Vertical red dashed lines indicate the last infall time of the subhalo.
Current usage metrics show cumulative count of Article Views (full-text article views including HTML views, PDF and ePub downloads, according to the available data) and Abstracts Views on Vision4Press platform.
Data correspond to usage on the plateform after 2015. The current usage metrics is available 48-96 hours after online publication and is updated daily on week days.
Initial download of the metrics may take a while.