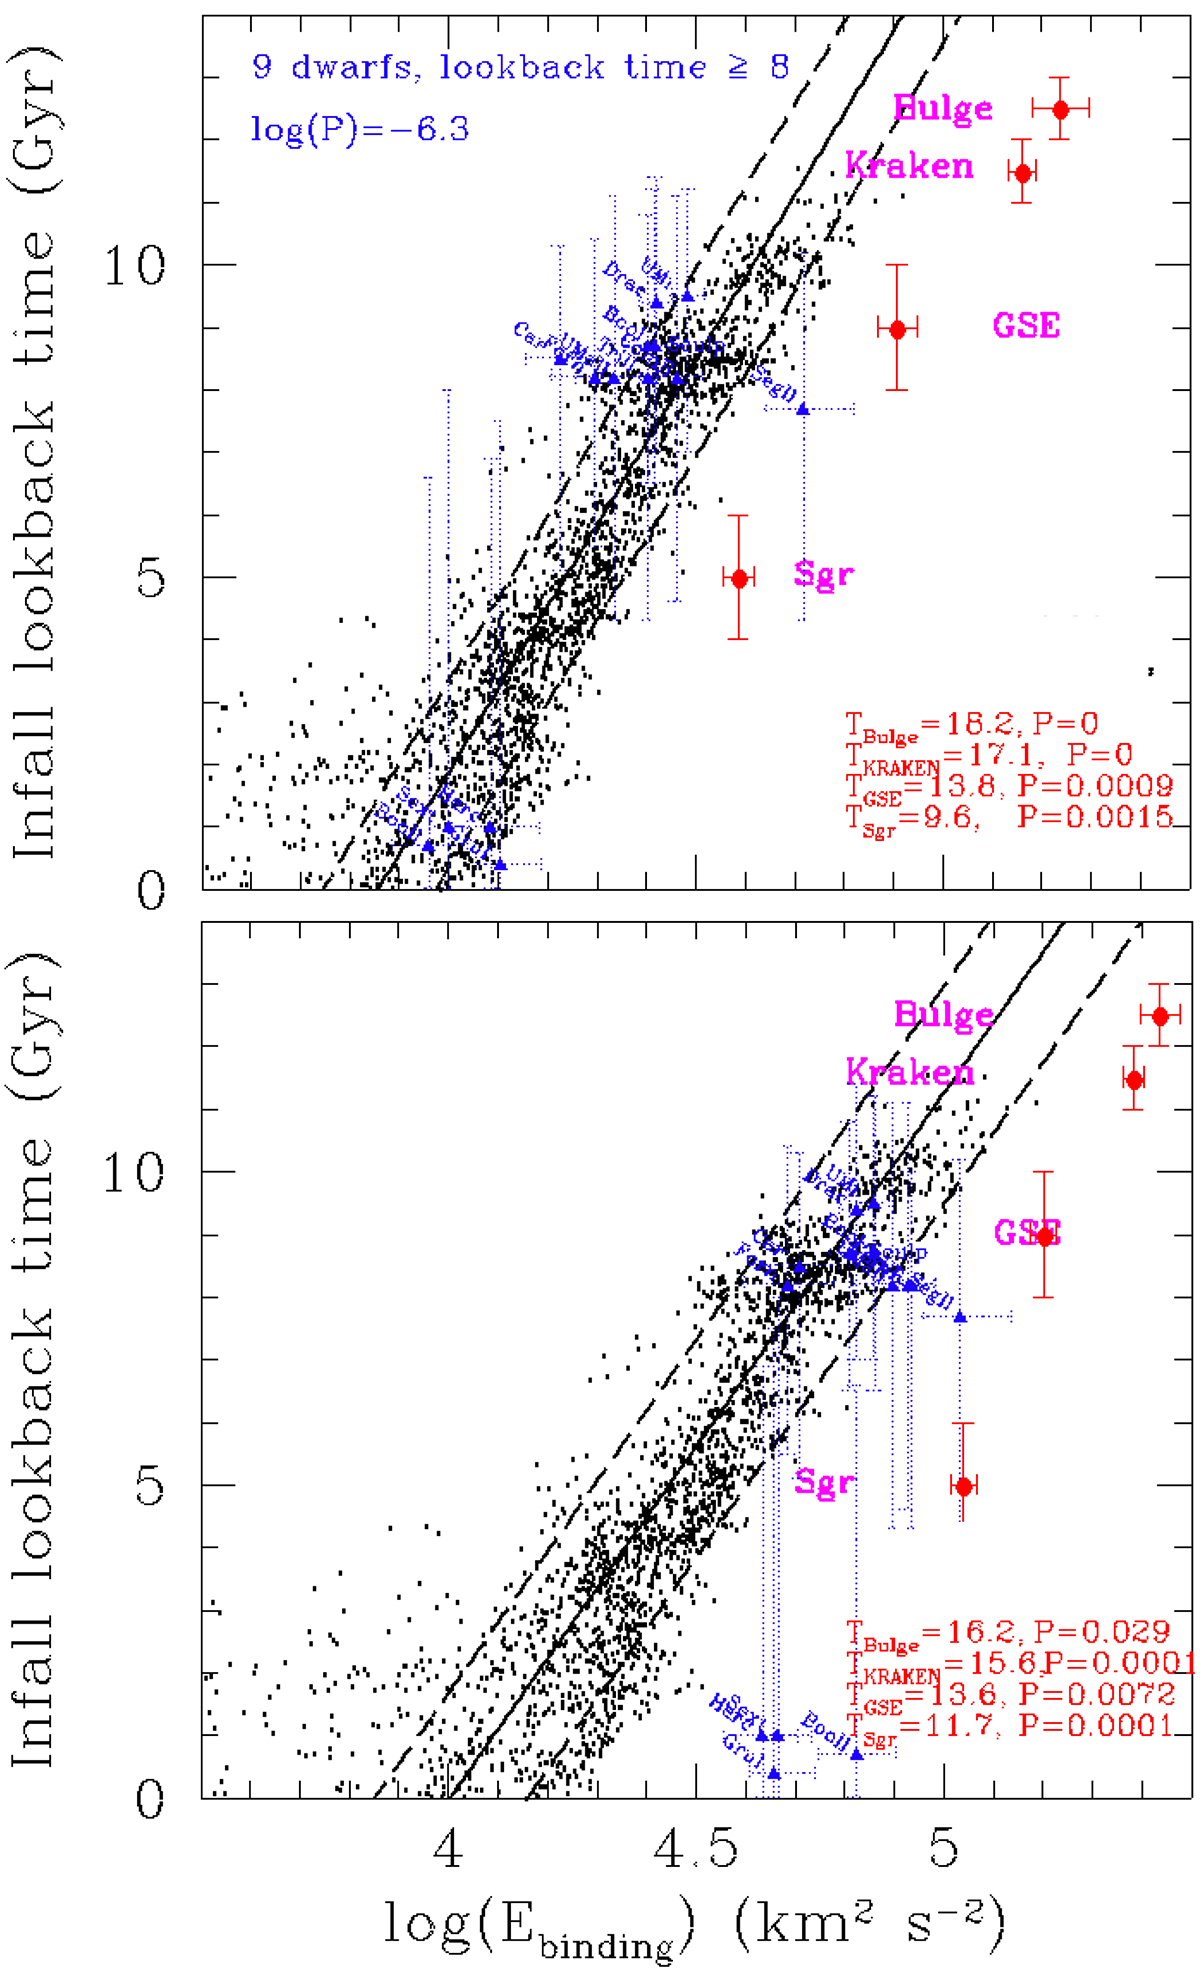
Fig. A.1.
Download original image
Same as Fig. 1, but for different mass re-scalings of the Rocha et al. (2012) simulations. In the bottom right of each panel the numbers indicate the predicted time for GCs associated with the bulge, GSE, and Sgr when they are inserted into the m12c halo potential, as well as the probability they can lie in the distribution of subhalos. (Top:) We have scaled down the Rocha et al. (2012) main halo mass to 7.4× 10¹⁰ M⊙ and add a baryonic component of 6.2× 10¹¹ M⊙, similar to that used in Jiao et al. (2023) and Ou et al. (2024). (Bottom panel:) We have scaled up the Rocha et al. (2012) main halo mass to 19.4× 10¹⁰ M⊙, also adding a baryonic mass of 6.2× 10¹¹ M⊙.
Current usage metrics show cumulative count of Article Views (full-text article views including HTML views, PDF and ePub downloads, according to the available data) and Abstracts Views on Vision4Press platform.
Data correspond to usage on the plateform after 2015. The current usage metrics is available 48-96 hours after online publication and is updated daily on week days.
Initial download of the metrics may take a while.