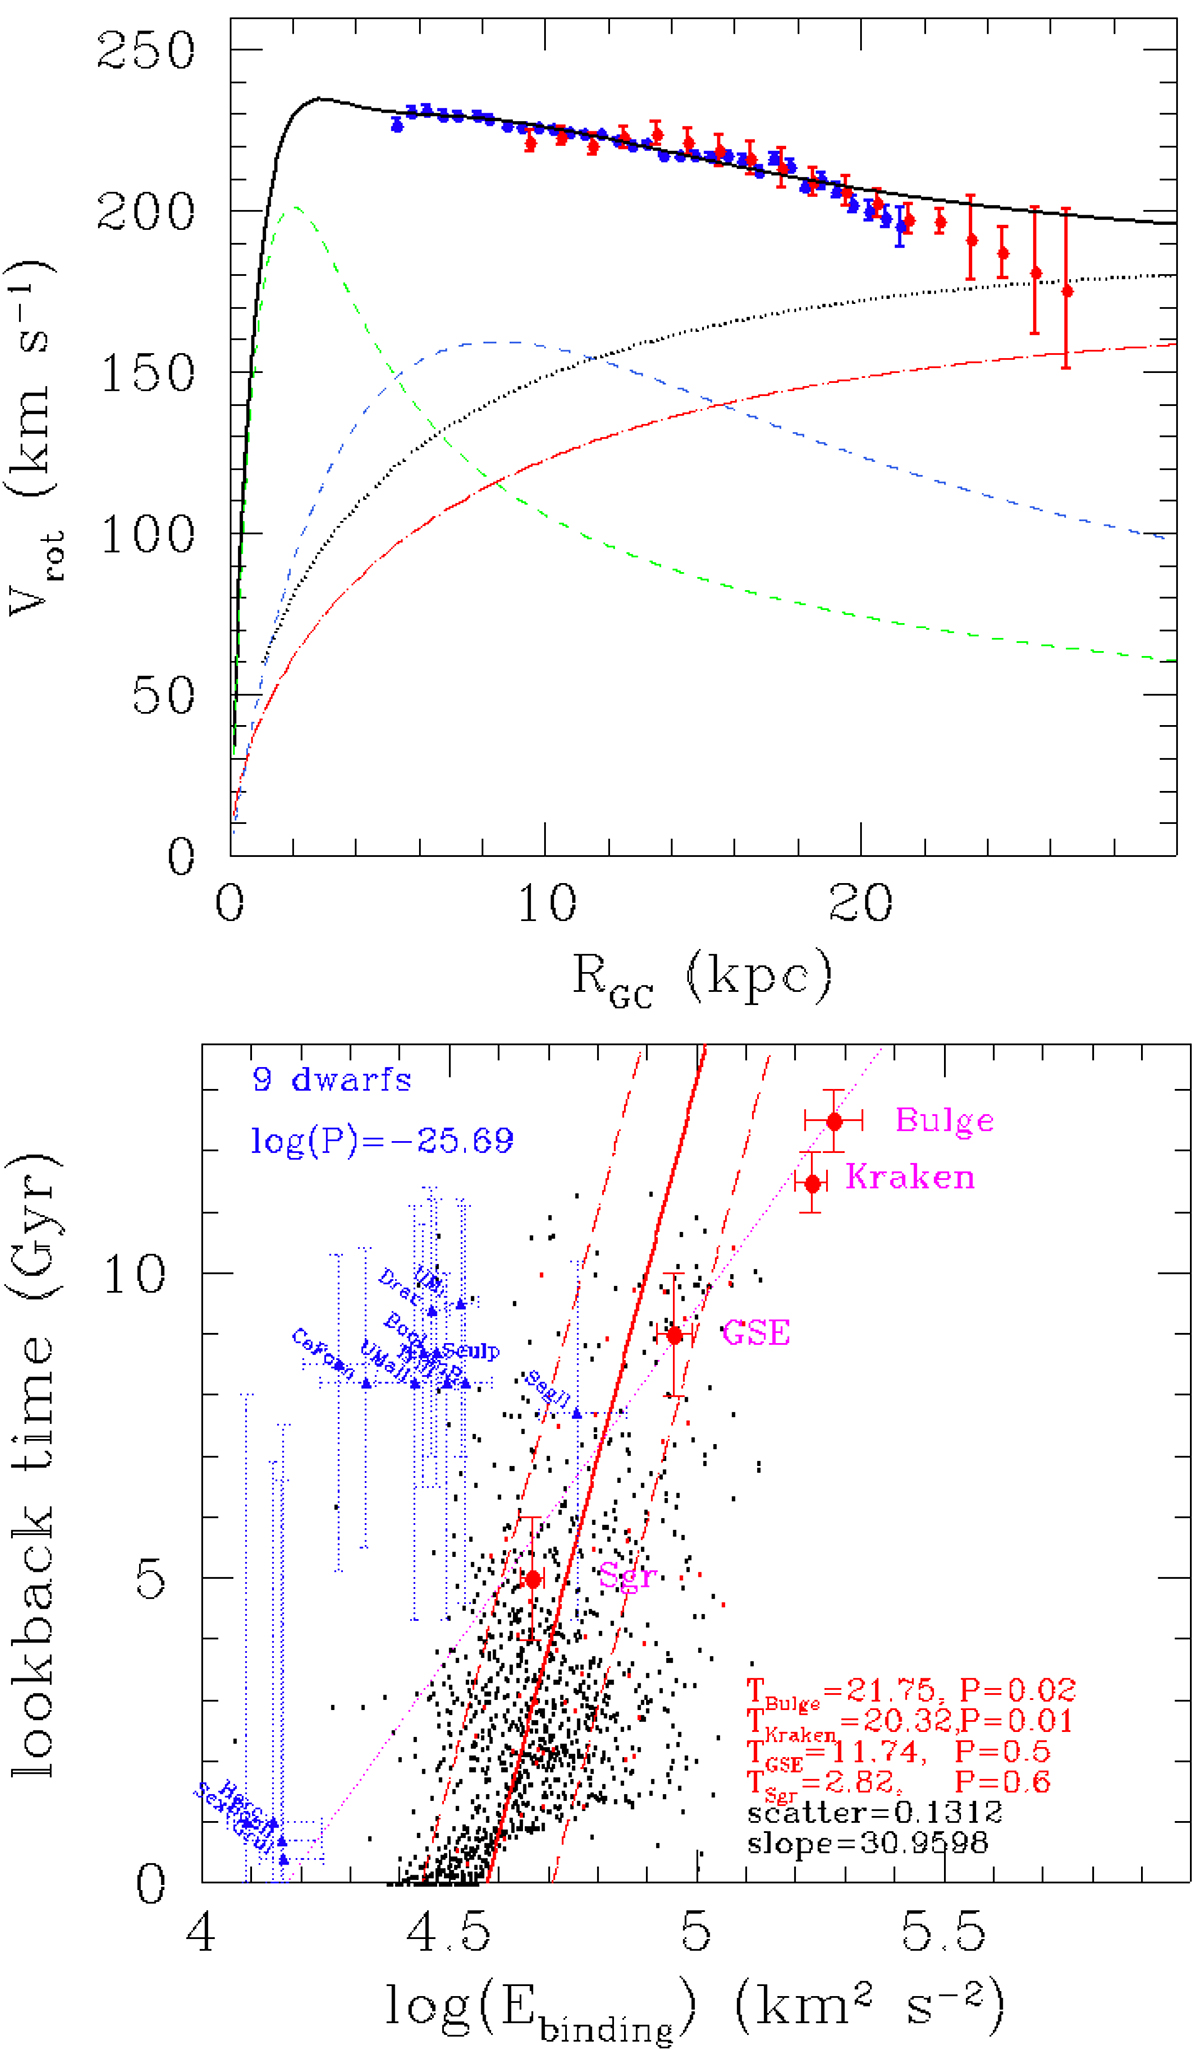
Fig. 2.
Download original image
Rotation curve and MW accretion history for the FIRE model m12c. Top panel: Rotation curve from an isolated MW-like galaxy from FIRE (halo m12c) compared to Gaia data. The blue points show DR2 (Eilers et al. 2019) without systematics, and the red points show DR3 (Jiao et al. 2023), which includes measurements from Wang et al. (2023) plus systematic errors. The contributions from the DM halo, bulge, and disk are plotted as long-dash red, short-dash green, and short-dash blue lines, respectively. To illustrate the impact of the very massive halo from Rocha et al. (2012), we also added its contribution (dotted black line), which far exceeds the FIRE m12c DM halo. Bottom panel: Same as the bottom panel of Figure 1, but for the FIRE halo m12c. The binding energies of dwarf galaxies and of GCs associated with MW events were calculated using the observed kinetic energy together with the potential of each main halo. The top left corner of the panel displays the combined probability that the nine dwarfs have infall lookback times longer then 8 Gyr, as predicted by Barmentloo & Cautun (2023). In the bottom right corner of the panel, the numbers indicate the predicted time for GCs associated with the bulge, GSE, and Sgr when they are inserted into the m12c halo potential, as well as the probability that they lie in the distribution of subhalos.
Current usage metrics show cumulative count of Article Views (full-text article views including HTML views, PDF and ePub downloads, according to the available data) and Abstracts Views on Vision4Press platform.
Data correspond to usage on the plateform after 2015. The current usage metrics is available 48-96 hours after online publication and is updated daily on week days.
Initial download of the metrics may take a while.