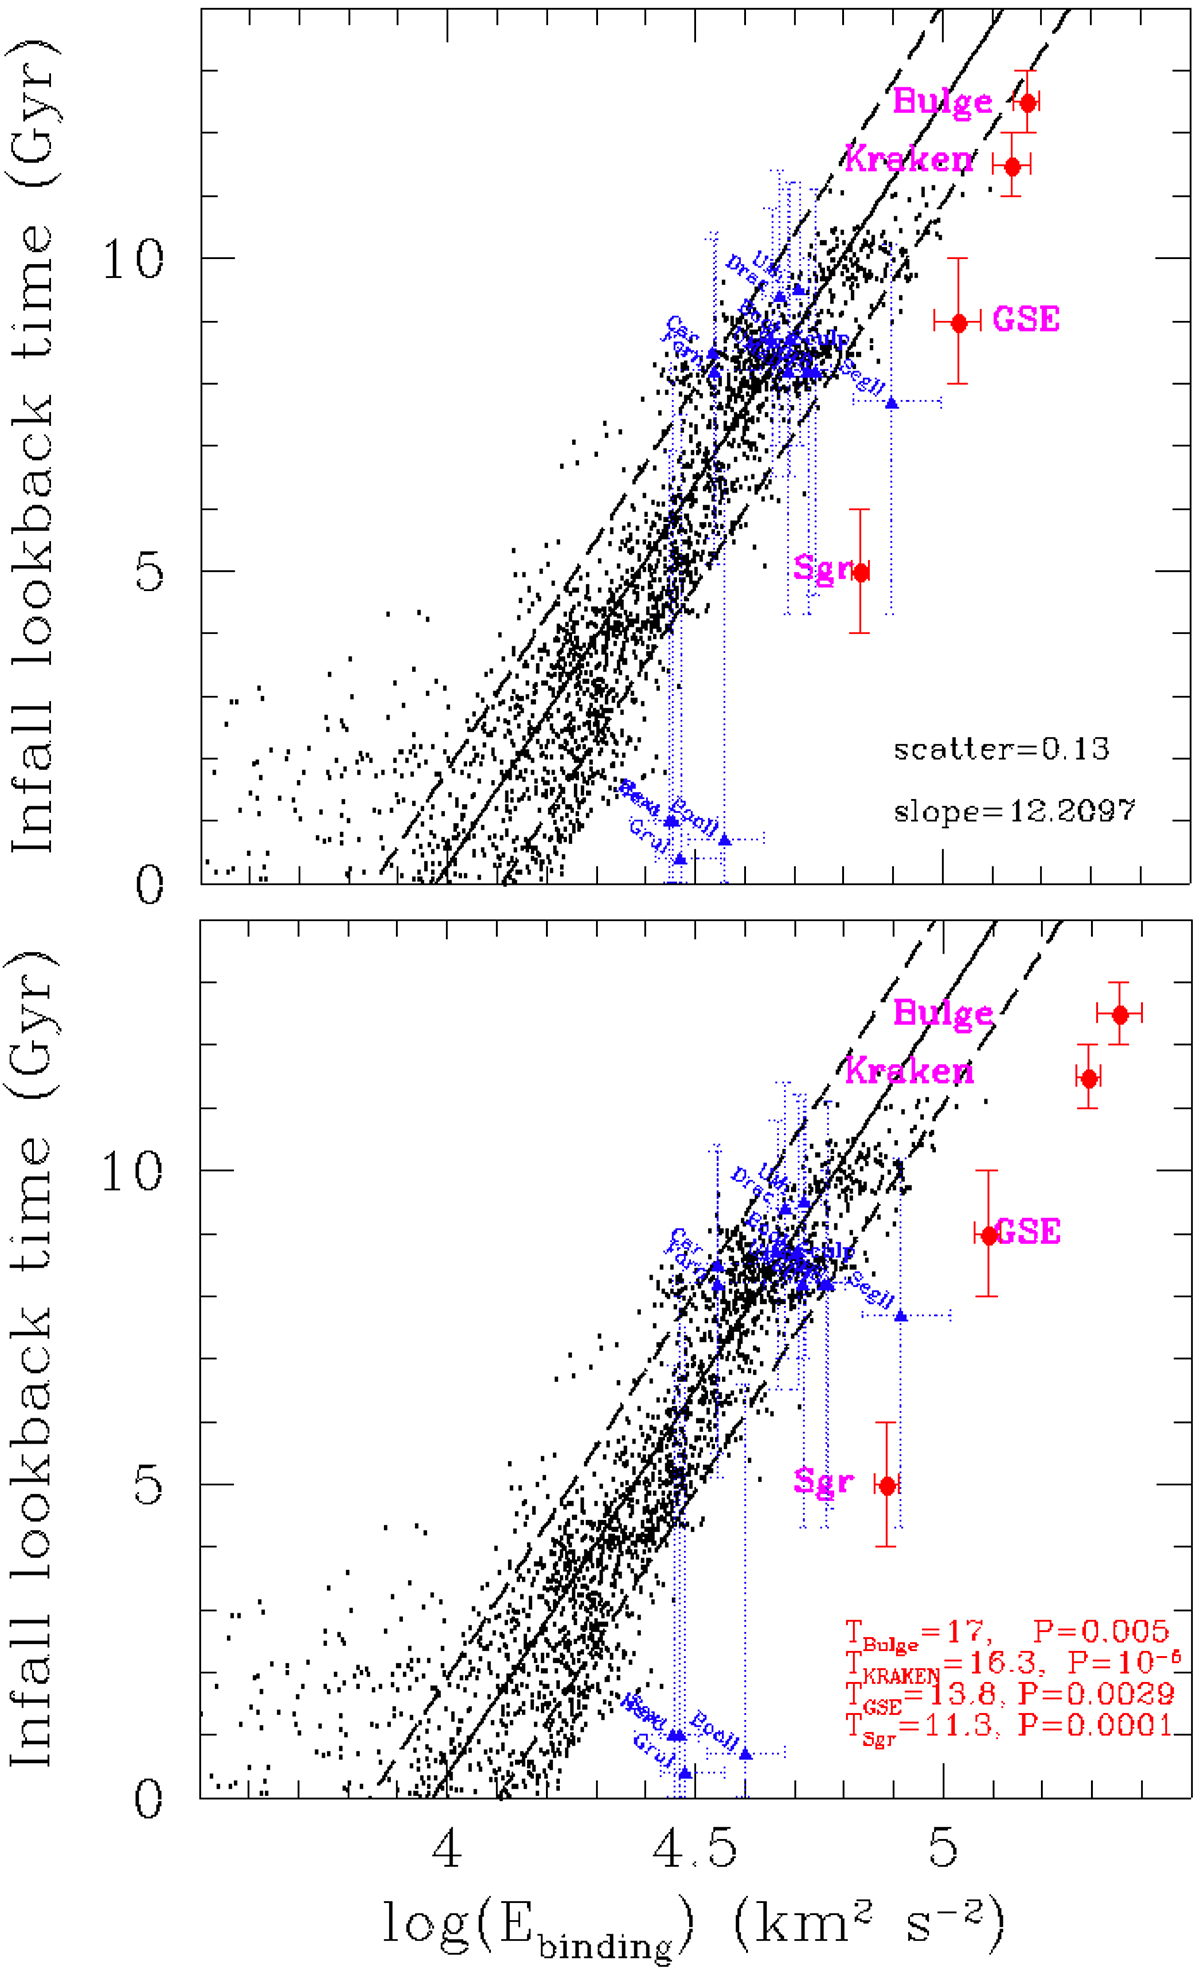
Fig. 1.
Download original image
Relation between the infall lookback time and the logarithm of the binding energy, for which black dots represent the subhalos that are associated with the Rocha et al. (2012) simulation, the solid line represents the best fit, and the dashed lines show its one σ scatter. The binding energies of dwarf galaxies (blue triangles) and of GCs associated with MW events (red dots with corresponding labels in magenta) are calculated using the observed kinetic energy together with the potential of the main halo. The blue triangles indicate the location of dwarf galaxies with a very good accuracy (< 0.1 dex) in binding energy, and for which we adopted the predicted dwarf infall time of Barmentloo & Cautun (2023). Top panel: Relation as derived from the Rocha et al. (2012) dark-matter-only simulations. Bottom panel: Same as the top panel, but we added a baryonic mass (1.4 × 10¹² M⊙) after a slight rescaling of the dark matter halo mass from 1.34 × 10¹² M⊙ to M200c = 1.4 × 10¹² M⊙ (see Appendix A). In the bottom right corner of the panel, the numbers indicate the predicted time for GCs associated with the bulge, GSE, and Sgr when they are inserted into the halo potential, as well as the probability that they lie in the distribution of simulated subhalos.
Current usage metrics show cumulative count of Article Views (full-text article views including HTML views, PDF and ePub downloads, according to the available data) and Abstracts Views on Vision4Press platform.
Data correspond to usage on the plateform after 2015. The current usage metrics is available 48-96 hours after online publication and is updated daily on week days.
Initial download of the metrics may take a while.