Fig. 9.
Download original image
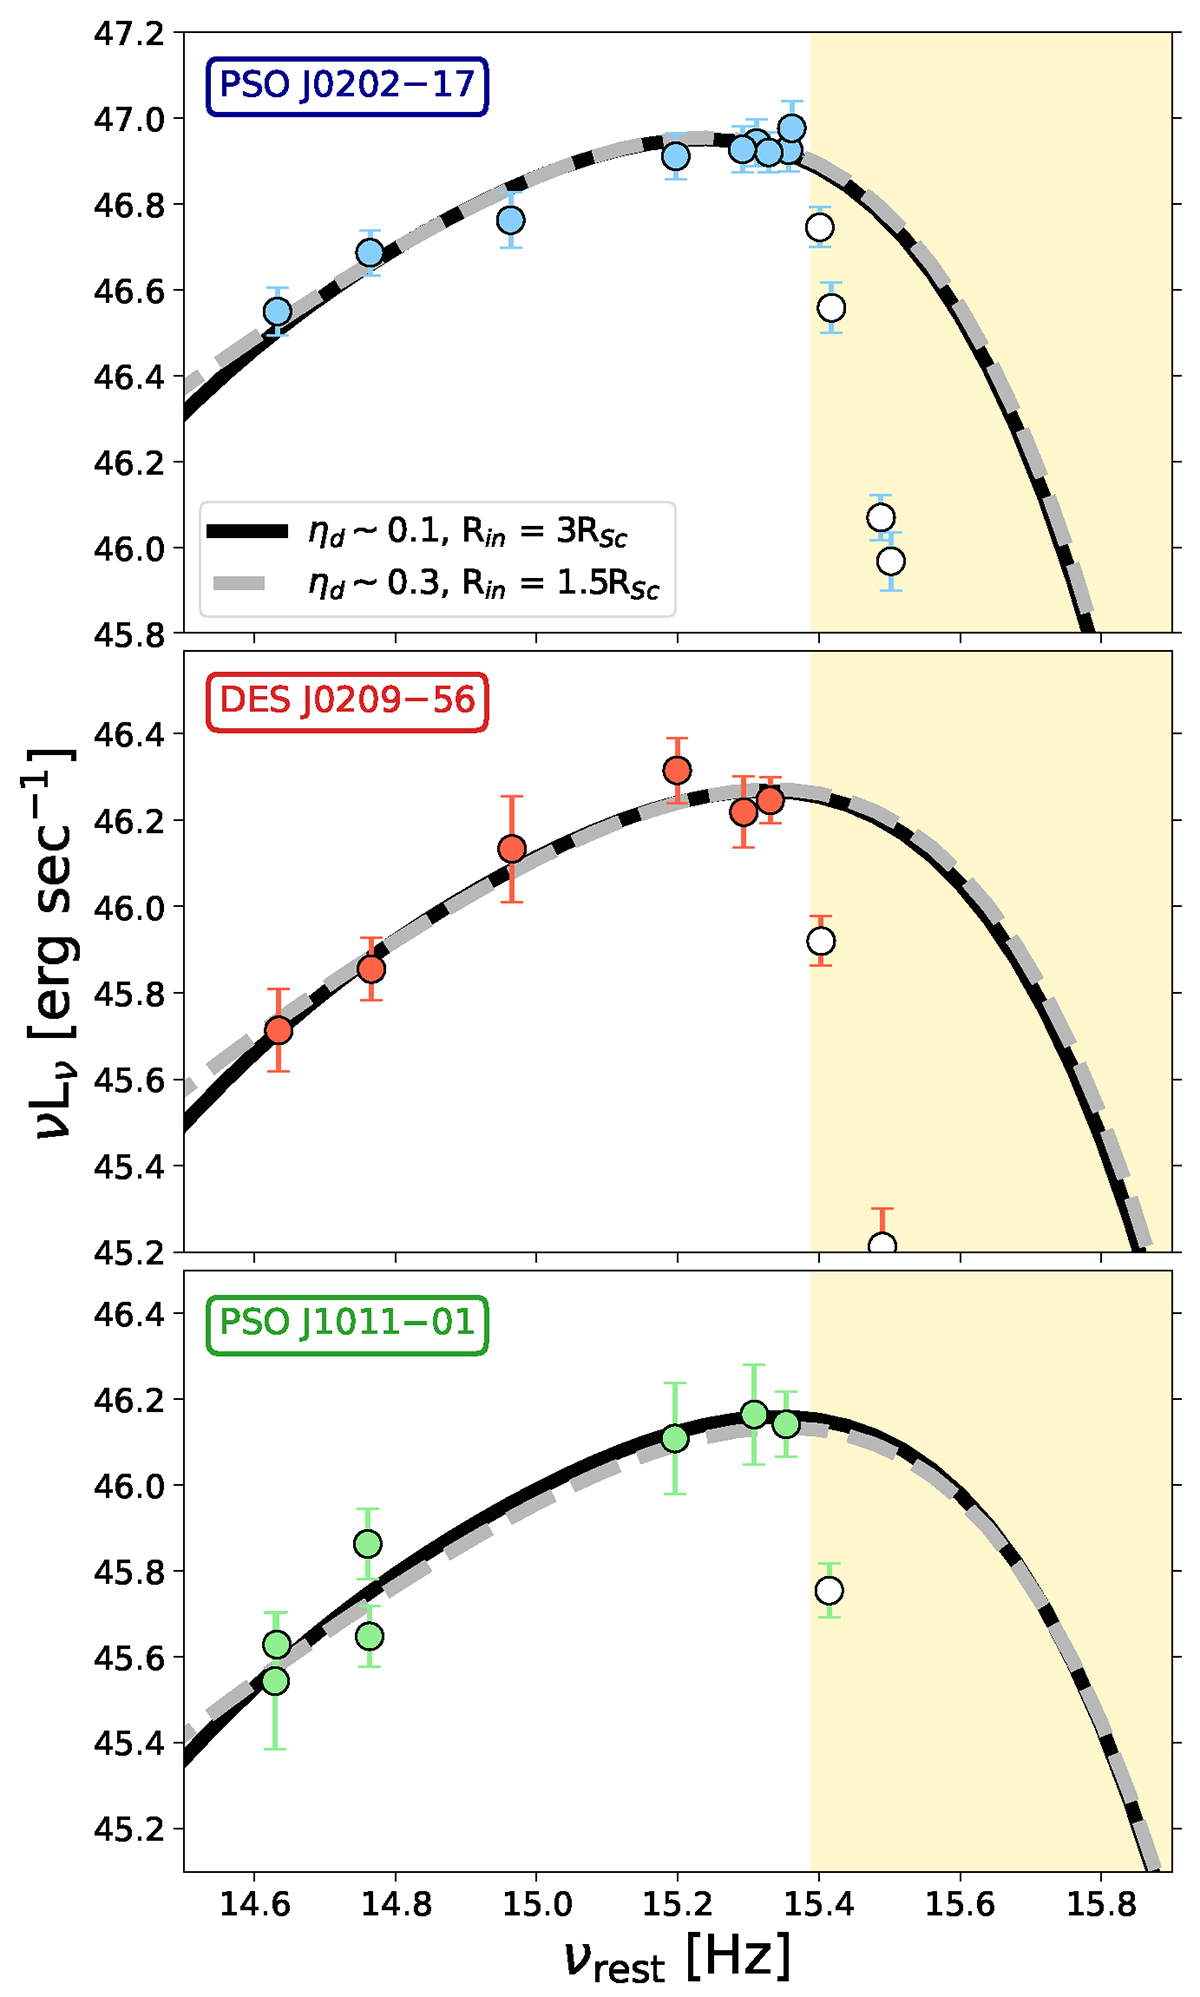
Rest-frame optical-UV SED of the three sources discussed in this work. The best-fit AD models derived for each target are reported as a black solid line (ηd ∼ 0.1) and a grey dashed line (ηd ∼ 0.3). During the fit, we only considered photometric data points (filled circles) not affected by IGM absorption (shaded area in yellow) and we did not use data affected, even marginally, by such absorption (white circles).
Current usage metrics show cumulative count of Article Views (full-text article views including HTML views, PDF and ePub downloads, according to the available data) and Abstracts Views on Vision4Press platform.
Data correspond to usage on the plateform after 2015. The current usage metrics is available 48-96 hours after online publication and is updated daily on week days.
Initial download of the metrics may take a while.