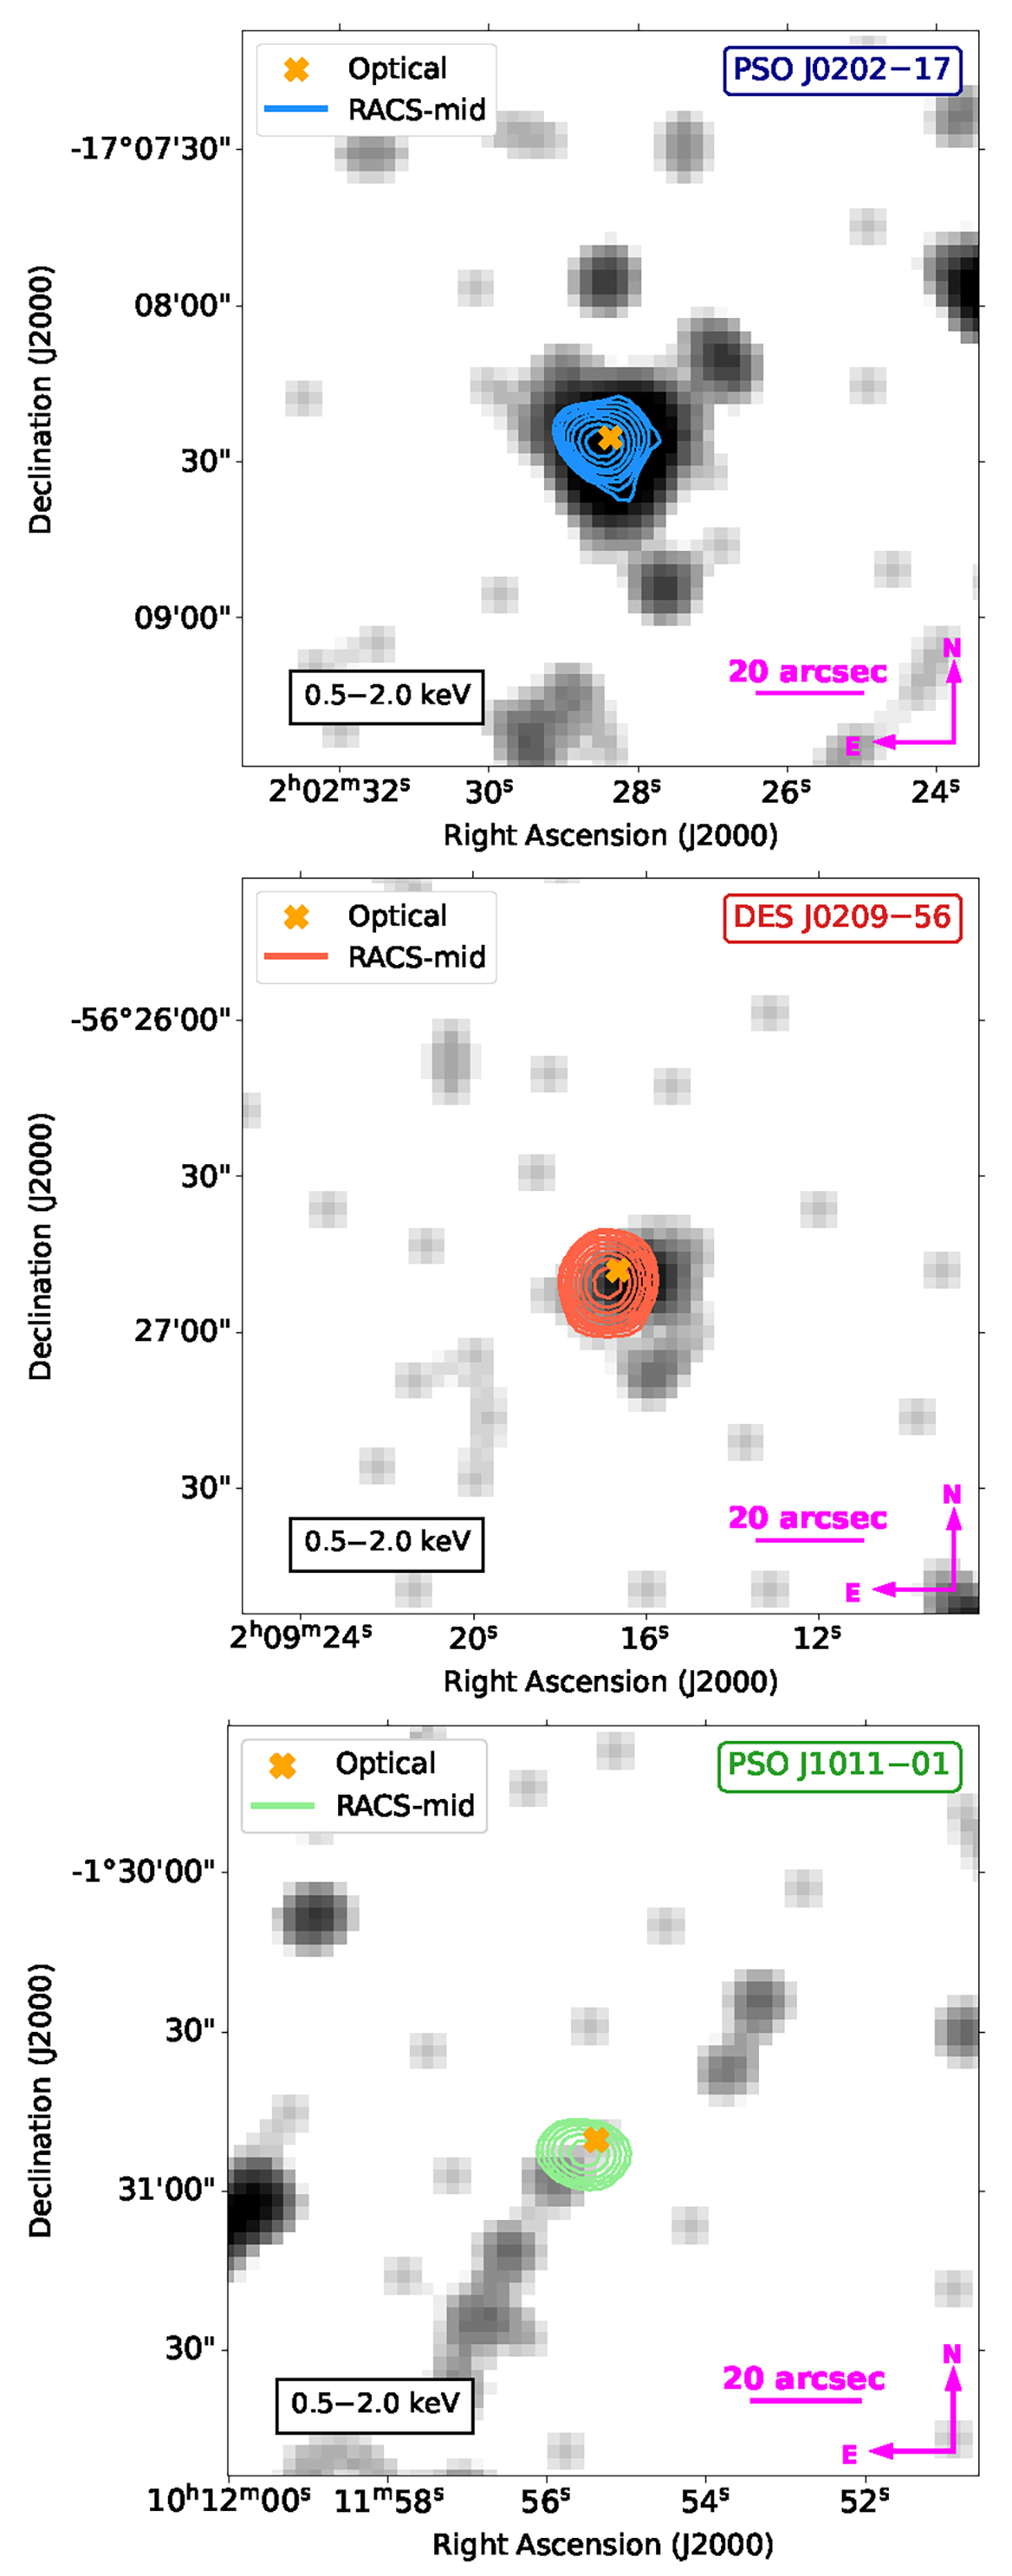
Fig. 6.
Download original image
X-ray images in the 0.5–2 keV energy range of the three high-z sources described in this paper obtained with the Swift-XRT telescope and smoothed with a Gaussian function with σ = 2 pixels (∼4.7″). The orange cross indicates the optical position of the QSO, while the contours are from the RACS-mid images and are drawn starting from ±5× off-source RMS and spaced by factors of ![]() .
.
Current usage metrics show cumulative count of Article Views (full-text article views including HTML views, PDF and ePub downloads, according to the available data) and Abstracts Views on Vision4Press platform.
Data correspond to usage on the plateform after 2015. The current usage metrics is available 48-96 hours after online publication and is updated daily on week days.
Initial download of the metrics may take a while.