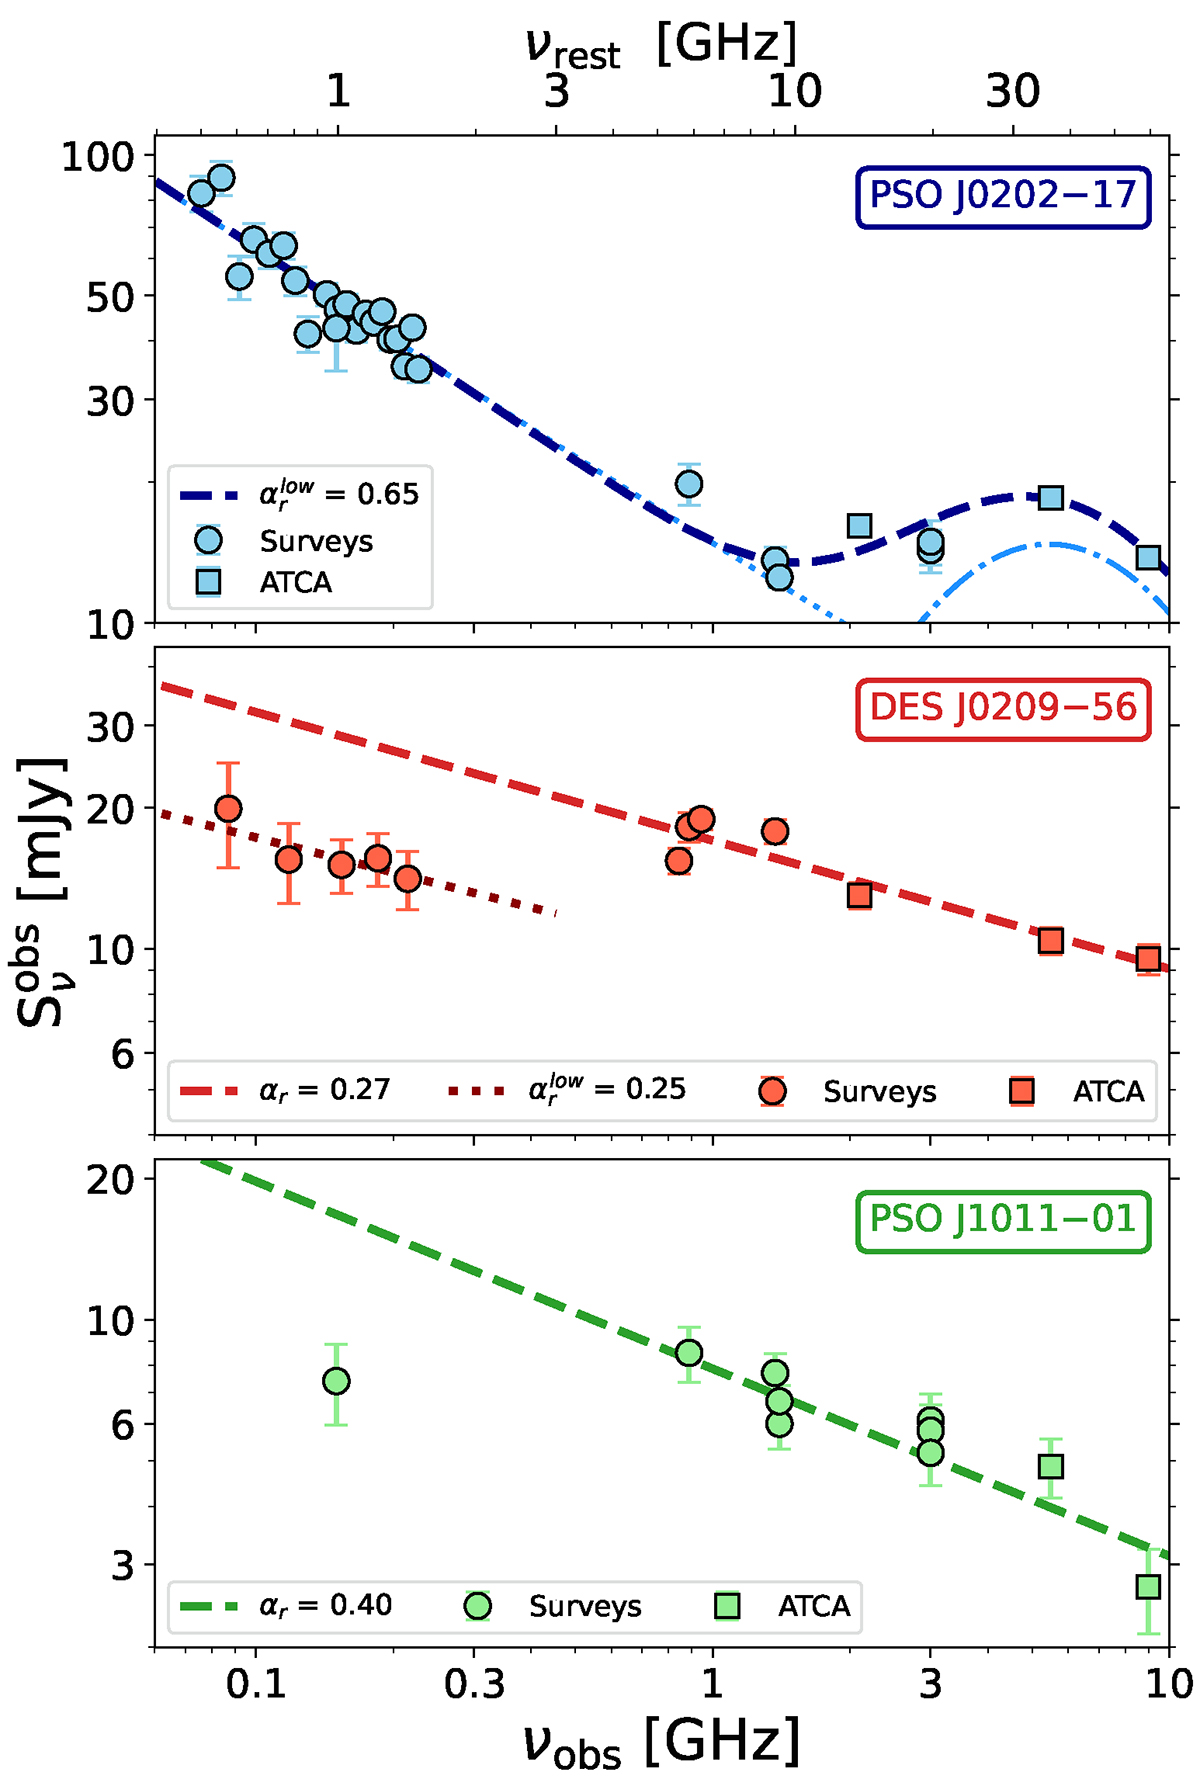
Fig. 4.
Download original image
Radio spectra over the ∼0.1 − 10 GHz observed frequency range of the three sources described in this work. The rest-frame frequencies (top labels) were computed assuming a common redshift, z = 5.6, for all the three objects. The majority of the data points are from public surveys (circles), while the 2.1, 5.5 and 9 GHz measurements are from dedicated, simultaneous observations with ATCA (squares). The dashed line in each panel indicates the best-fit model obtained for the different objects as described in the text. The dotted line in the central panel corresponds to the best-fit power law obtained from the GLEAM-X data only, while the dotted and the dashed-dotted lines in the top panel show the two spectral components used during the fit, as described in the text.
Current usage metrics show cumulative count of Article Views (full-text article views including HTML views, PDF and ePub downloads, according to the available data) and Abstracts Views on Vision4Press platform.
Data correspond to usage on the plateform after 2015. The current usage metrics is available 48-96 hours after online publication and is updated daily on week days.
Initial download of the metrics may take a while.