Fig. 3.
Download original image
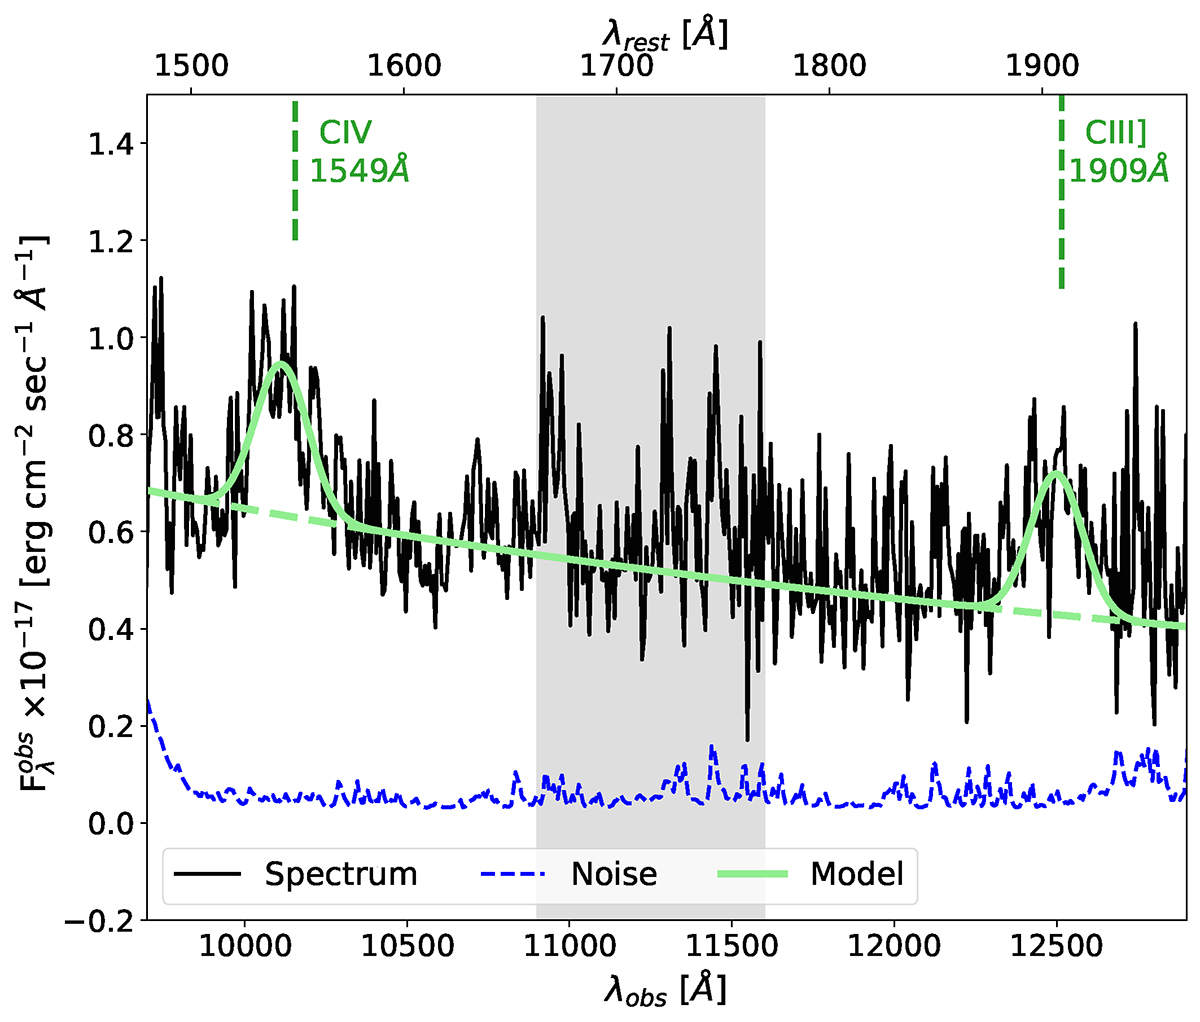
Combined LUCI1+LUCI2 spectrum of PSO J1011−01 around the CIV and CIII] emission lines. The spectrum (black solid line) is binned at 6.5 Å, that is, three times the native resolution. The dashed blue line shows the noise of the final spectrum derived from the data reduction. The solid light green line is the best-fit model of the continuum plus the CIV and CIII] emission lines. The shaded grey area indicates wavelengths heavily affected by telluric absorption that were not considered during the fit.
Current usage metrics show cumulative count of Article Views (full-text article views including HTML views, PDF and ePub downloads, according to the available data) and Abstracts Views on Vision4Press platform.
Data correspond to usage on the plateform after 2015. The current usage metrics is available 48-96 hours after online publication and is updated daily on week days.
Initial download of the metrics may take a while.