Fig. 5.
Download original image
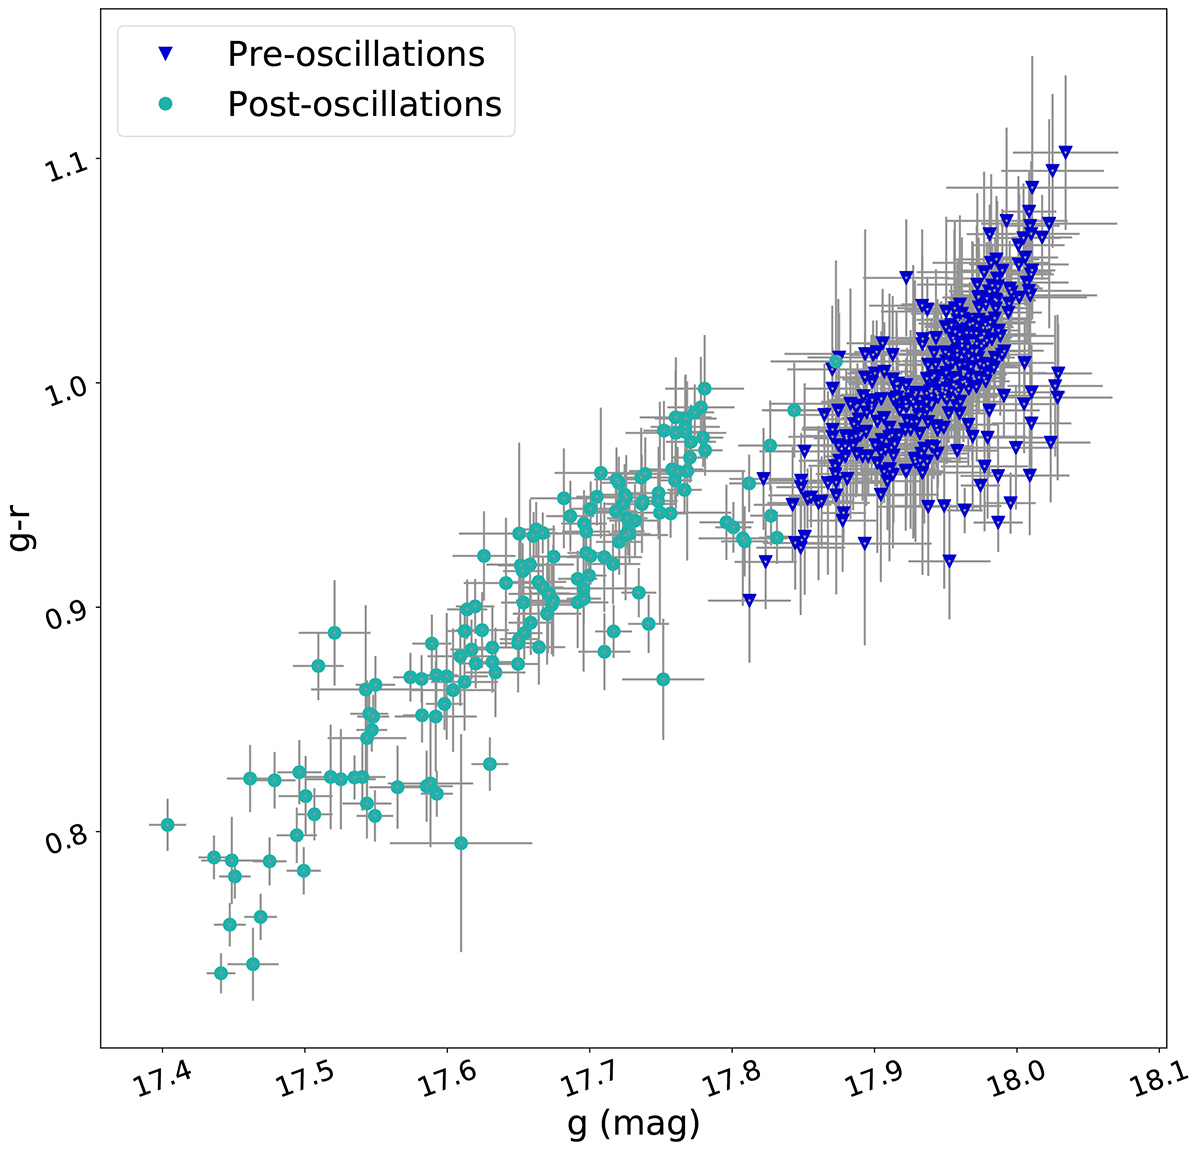
Color vs. magnitude diagram. The color is obtained from the apparent magnitudes and the magnitude is in the g band. The blue triangles and cyan circles represent dates before and after the oscillations started in AT 2021hdr (MJD = 59520). We note that this date does not correspond to the first alert but to the date when oscillations begin.
Current usage metrics show cumulative count of Article Views (full-text article views including HTML views, PDF and ePub downloads, according to the available data) and Abstracts Views on Vision4Press platform.
Data correspond to usage on the plateform after 2015. The current usage metrics is available 48-96 hours after online publication and is updated daily on week days.
Initial download of the metrics may take a while.