Open Access
Fig. 4.
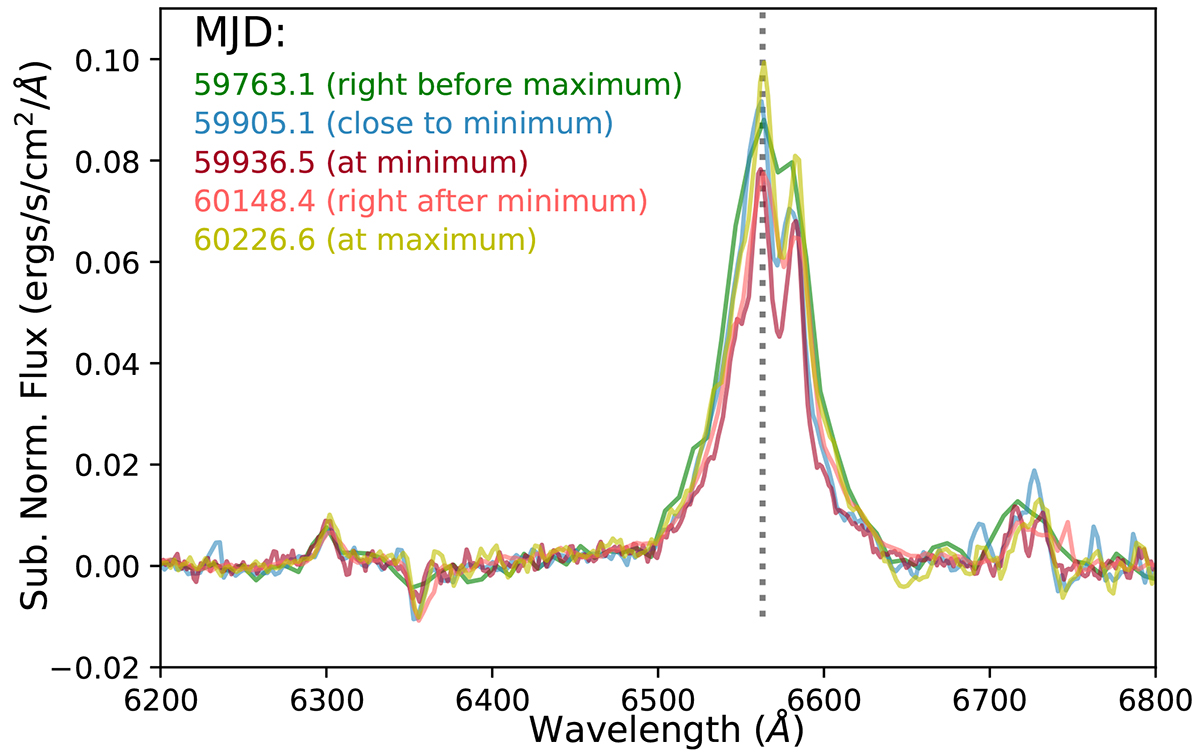
Download original image
Hα region of AT 2021hdr. From top to bottom, spectra from the LT, SPM, HCT, NOT, and SPM are presented in chronological order. The spectra are normalized for visualization purposes (see text).
Current usage metrics show cumulative count of Article Views (full-text article views including HTML views, PDF and ePub downloads, according to the available data) and Abstracts Views on Vision4Press platform.
Data correspond to usage on the plateform after 2015. The current usage metrics is available 48-96 hours after online publication and is updated daily on week days.
Initial download of the metrics may take a while.