Open Access
Fig. D.4.
Download original image
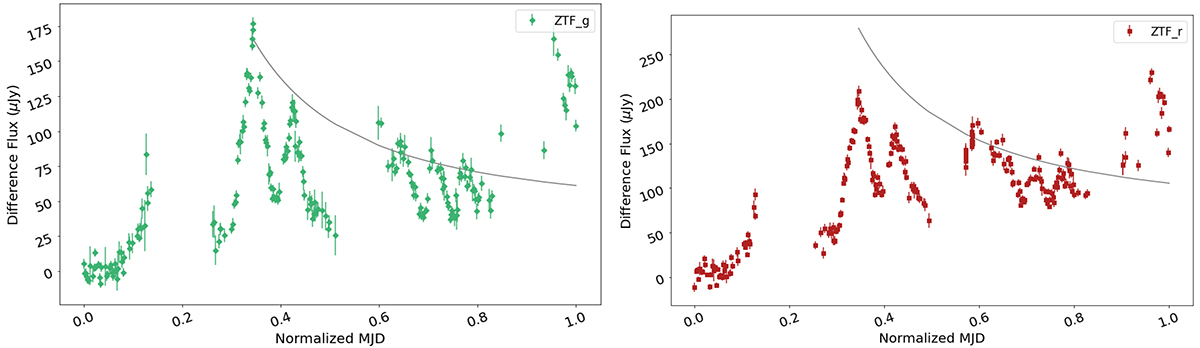
TDE fitting to the whole light curve in the g and r bands. The black line represents a decay model with spectral index 5/3 as expected for a TDE. The light curves include dates after MJD 59683 to consider only the oscillations.
Current usage metrics show cumulative count of Article Views (full-text article views including HTML views, PDF and ePub downloads, according to the available data) and Abstracts Views on Vision4Press platform.
Data correspond to usage on the plateform after 2015. The current usage metrics is available 48-96 hours after online publication and is updated daily on week days.
Initial download of the metrics may take a while.