Open Access
Fig. D.3.
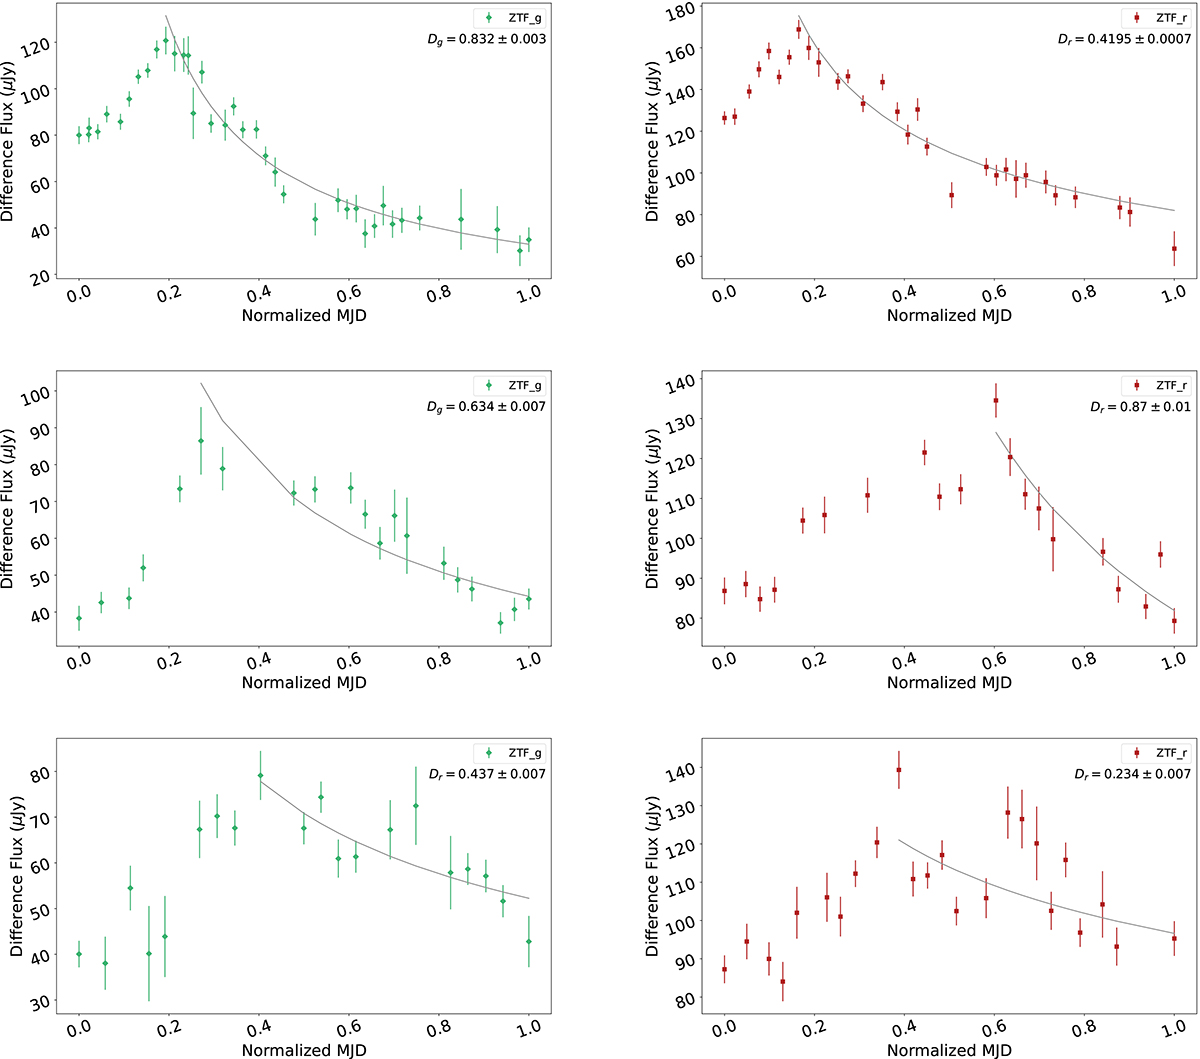
Download original image
TDE fitting to each peak. The black lines represent a decay model with a free spectral index. From top to bottom, peaks 1, 2, 5, and 6 from Fig. D.2. The legends include the ZTF band and the power law decay exponents.
Current usage metrics show cumulative count of Article Views (full-text article views including HTML views, PDF and ePub downloads, according to the available data) and Abstracts Views on Vision4Press platform.
Data correspond to usage on the plateform after 2015. The current usage metrics is available 48-96 hours after online publication and is updated daily on week days.
Initial download of the metrics may take a while.