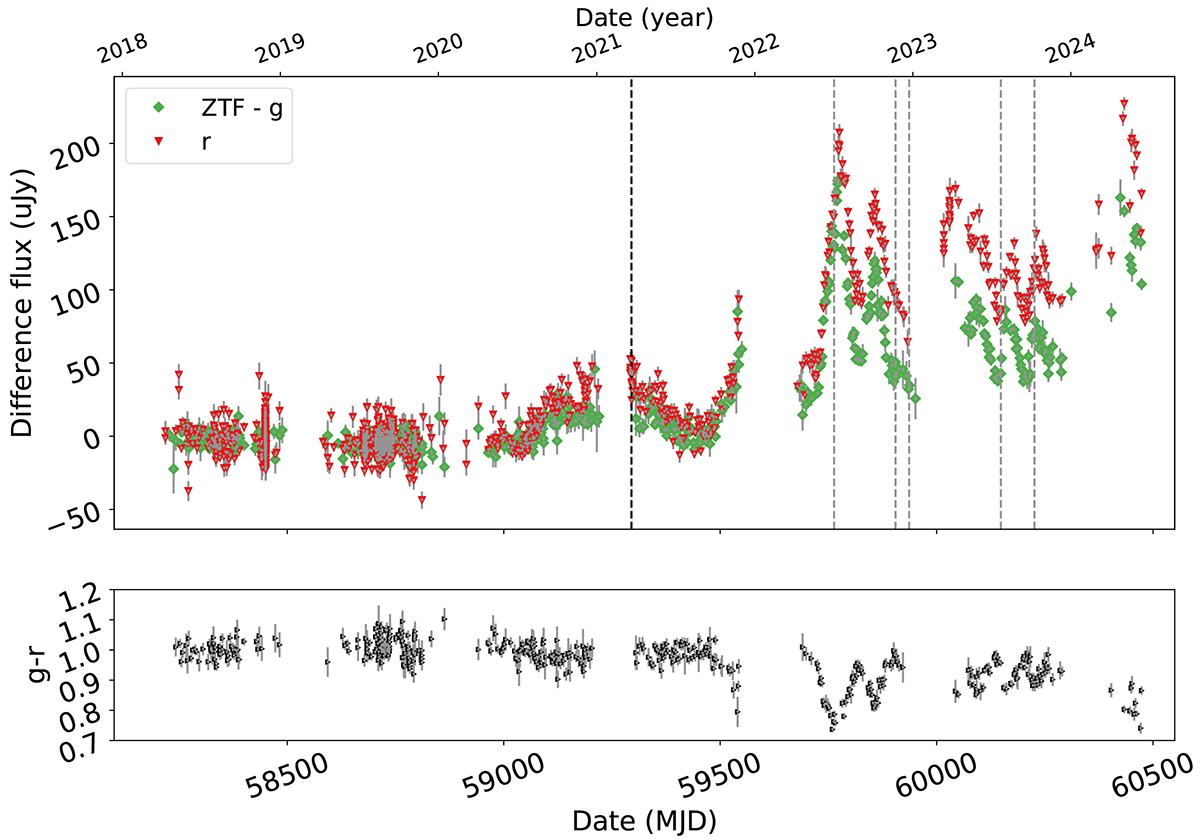
Fig. 1.
Download original image
ZTF light curve of AT 2021hdr between 2018-2024. (Top panel): ZTF light curve (in difference flux from PSF forced photometry) of AT 2021hdr in the g (green squares) and r (red triangles). The black dashed line represents the date of the first ZTF alert, and the gray dashed lines correspond to dates when optical spectra were obtained. (Bottom panel): ZTF g-r color evolution in total magnitude (see text for details).
Current usage metrics show cumulative count of Article Views (full-text article views including HTML views, PDF and ePub downloads, according to the available data) and Abstracts Views on Vision4Press platform.
Data correspond to usage on the plateform after 2015. The current usage metrics is available 48-96 hours after online publication and is updated daily on week days.
Initial download of the metrics may take a while.