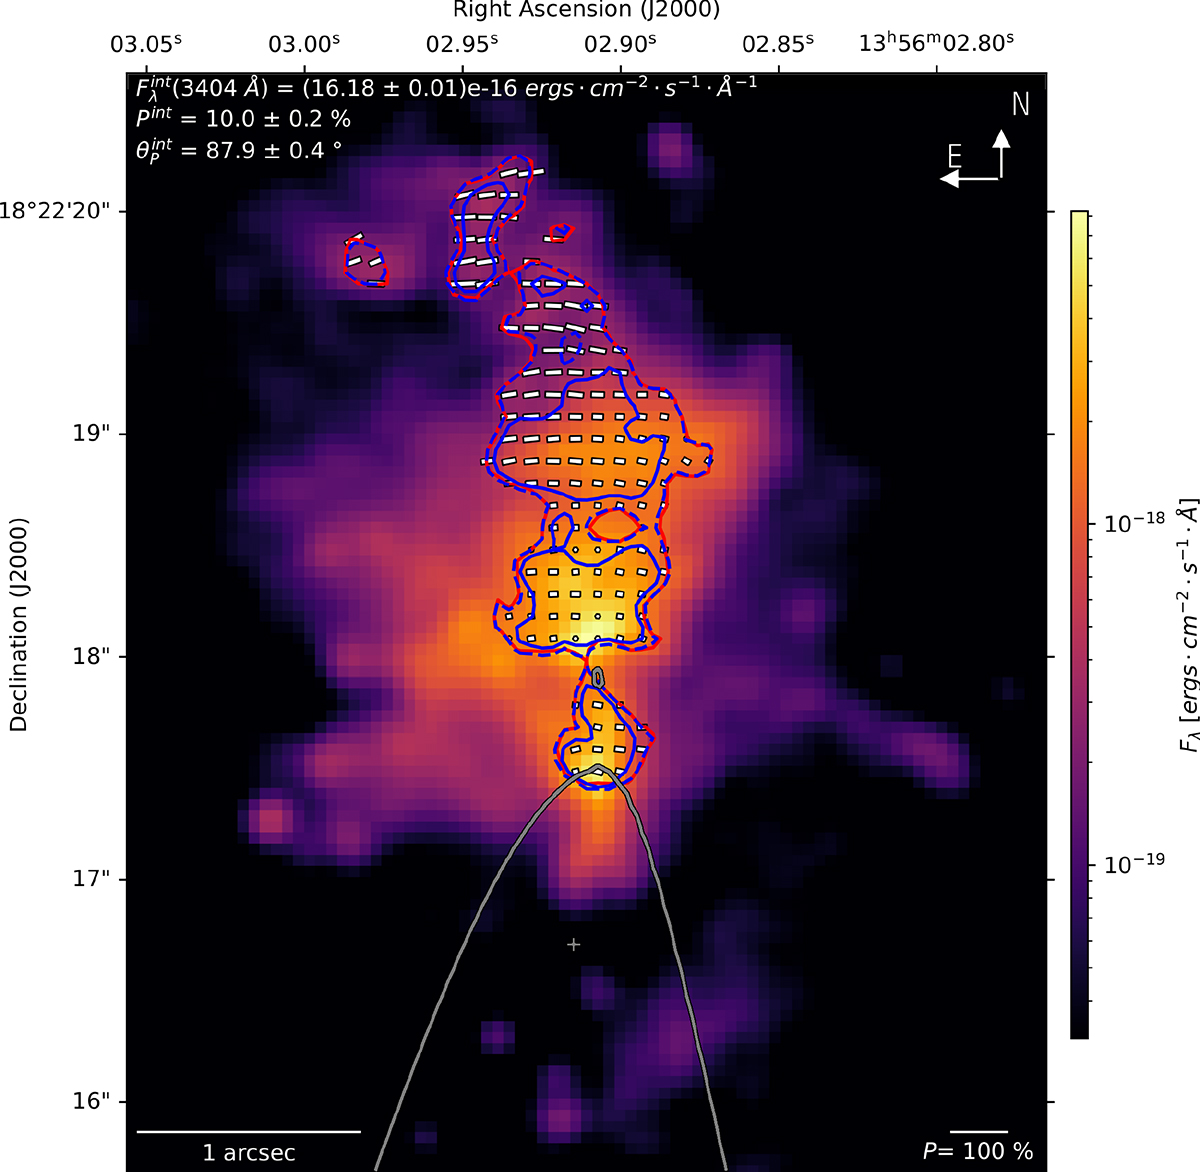
Fig. A.1.
Download original image
Comparison of the determination of a detection between levels of signal to noise ratio in debiased polarization degree in blue for 3 − σP (dashed line) and 4 − σP (solid line) with the Stokes Q and U fluxes confidence level defined in Eq. A.2 in red. The gray contour and position are the 99% confidence level and best guess for the position of the center of emission by minimizing Eq. B.1.
Current usage metrics show cumulative count of Article Views (full-text article views including HTML views, PDF and ePub downloads, according to the available data) and Abstracts Views on Vision4Press platform.
Data correspond to usage on the plateform after 2015. The current usage metrics is available 48-96 hours after online publication and is updated daily on week days.
Initial download of the metrics may take a while.