Open Access
Fig. 6.
Download original image
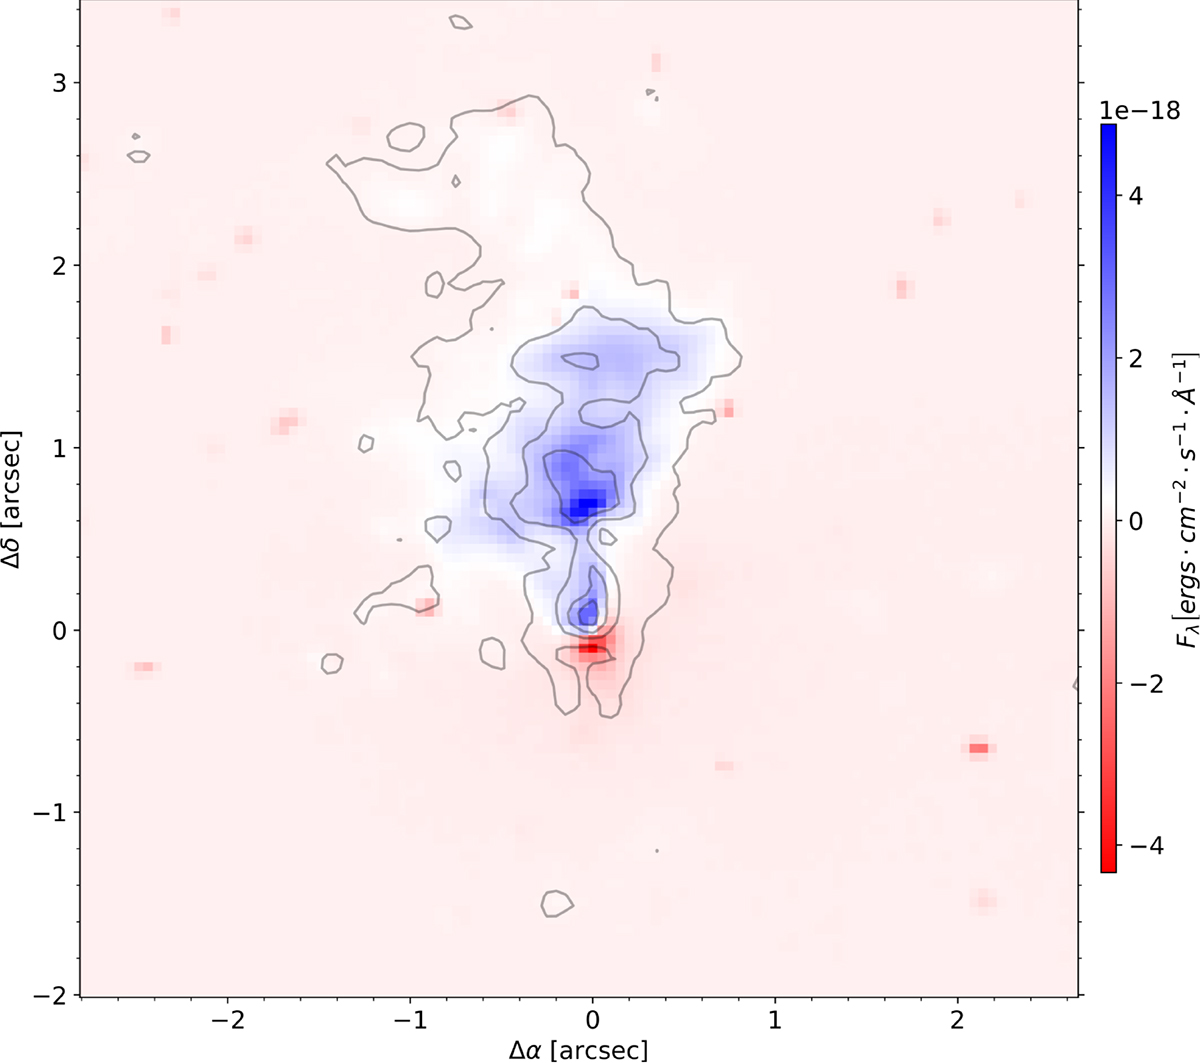
HST/WFPC2 image at 7996 Å subtracted from the HST/FOC image at 3404 Å. Both maps were binned to a 0.05″ pixel size and aligned on similar-looking features. The contours display the level of the NUV-polarized flux density, correlated with the polar wind of the AGN.
Current usage metrics show cumulative count of Article Views (full-text article views including HTML views, PDF and ePub downloads, according to the available data) and Abstracts Views on Vision4Press platform.
Data correspond to usage on the plateform after 2015. The current usage metrics is available 48-96 hours after online publication and is updated daily on week days.
Initial download of the metrics may take a while.