Fig. 1.
Download original image
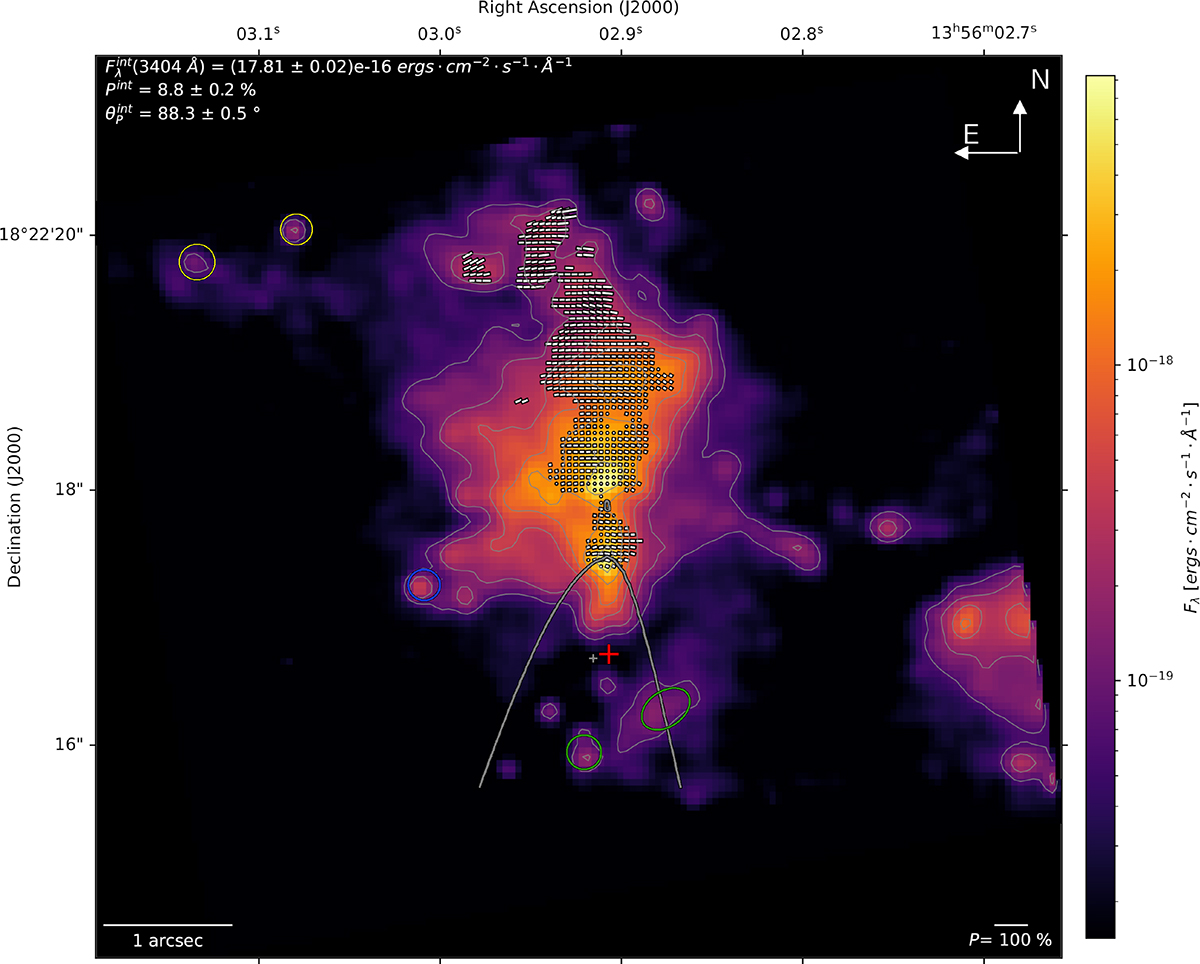
HST/FOC observation of Mrk 463E resampled to pixels of 0.05″ × 0.05″. The intensity is color-coded in erg cm−2 s−1 Å−1. The polarization vectors are displayed for ConfP ≥ 99%. The dark gray contour and cross, as well as the red cross, show our estimates for the nucleus location and are discussed in Sect. 3.1 and Appendix B. The flux density contours are displayed for 0.8%, 2%, 5%, 10%, 20%, and 50% of the maximum flux density. The top left corner values are integrated over the whole FOC FoV (7″ × 7″): Fλint = (17.81 ± 0.02)×10−16 ergs cm−2 s−1 Å−1 with Pint = 8.8 ± 0.2% and Ψint = 88.3 ± 0.5°. The circled spots are discussed in Sect. 3.1.
Current usage metrics show cumulative count of Article Views (full-text article views including HTML views, PDF and ePub downloads, according to the available data) and Abstracts Views on Vision4Press platform.
Data correspond to usage on the plateform after 2015. The current usage metrics is available 48-96 hours after online publication and is updated daily on week days.
Initial download of the metrics may take a while.