Fig. 6
Download original image
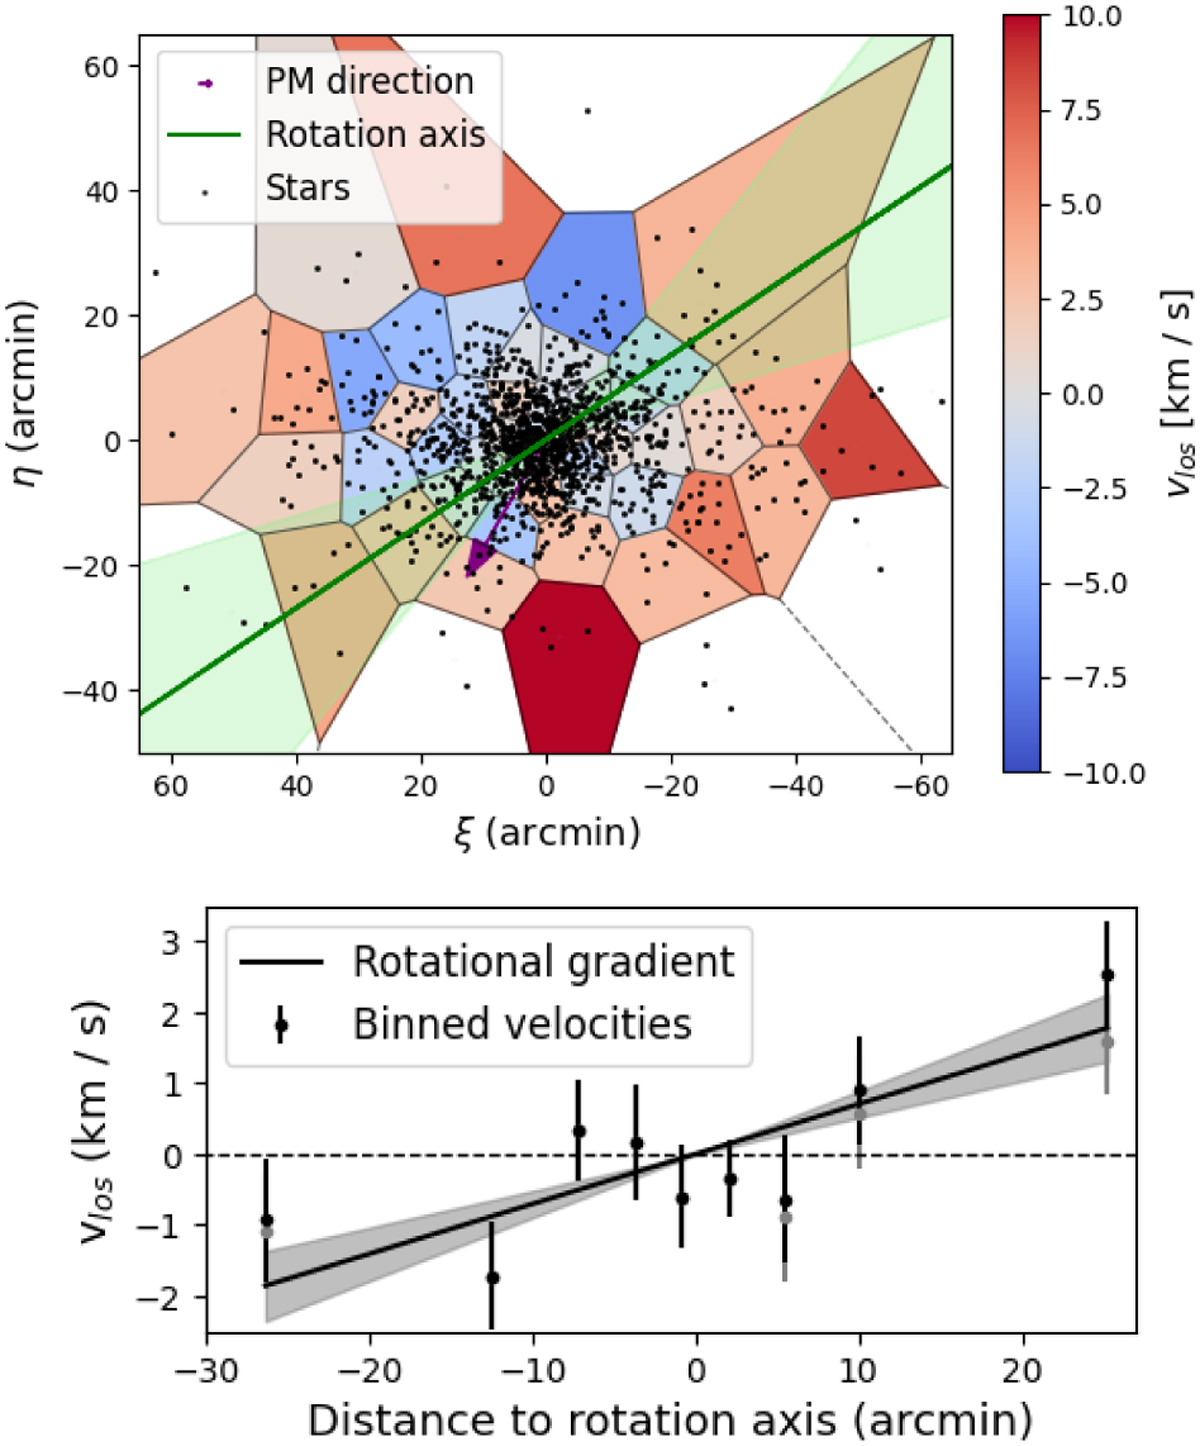
L.o.s. velocity gradient of Sculptor. Upper panel: L.o.s. velocity map of Sculptor centered in its systemic velocity and generated with Voronoi bins; it is color-coded by velocities as indicated in the color bar. The black dots indicate the position of the stars in our sample; the purple arrow indicates the systemic proper motion of the galaxy; finally, the green line is the rotation axis, with the bands indicating the 1σ error range. Lower panel: velocity profile of Sculptor along the direction perpendicular to the rotation axis (maximum velocity gradient). The dots indicate the value of the mean velocity with errors in certain bins at different distances to the rotation axis, in black using all stars and in gray removing those from pop 3; the solid line shows the rotational gradient of 4.0 km s−1 deg−1, with the bands showing the 1σ error range; finally, the dashed line indicates the systemic vlos of Sculptor.
Current usage metrics show cumulative count of Article Views (full-text article views including HTML views, PDF and ePub downloads, according to the available data) and Abstracts Views on Vision4Press platform.
Data correspond to usage on the plateform after 2015. The current usage metrics is available 48-96 hours after online publication and is updated daily on week days.
Initial download of the metrics may take a while.