Fig. 11.
Download original image
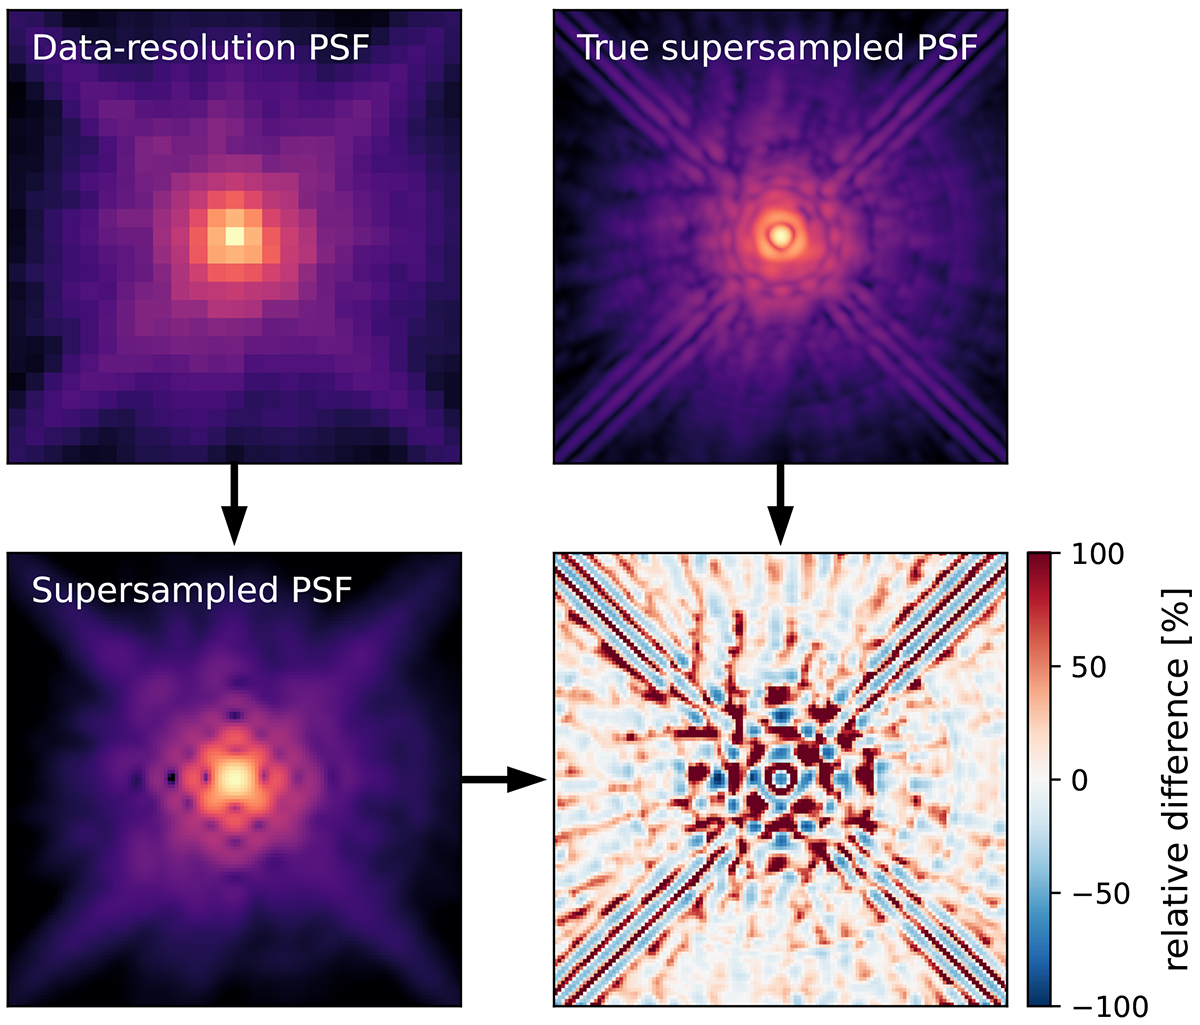
Comparison between the different PSF kernels used in this work (each panel shows a zoom on the central ![]() of the PSF kernel). The top left panel shows the original true PSF used for simulating the data, while the top right panel shows the PSF given to the modelers (same as in Fig. 1). The bottom left panel shows the bicubic-interpolated (5 times supersampled) PSF used in the model shown with dotted lines in Fig. 10, and the bottom right panel shows the relative difference with the true PSF. Except for the bottom right panel, all color scales are arbitrary and chosen to help the visual comparison between the PSF kernels.
of the PSF kernel). The top left panel shows the original true PSF used for simulating the data, while the top right panel shows the PSF given to the modelers (same as in Fig. 1). The bottom left panel shows the bicubic-interpolated (5 times supersampled) PSF used in the model shown with dotted lines in Fig. 10, and the bottom right panel shows the relative difference with the true PSF. Except for the bottom right panel, all color scales are arbitrary and chosen to help the visual comparison between the PSF kernels.
Current usage metrics show cumulative count of Article Views (full-text article views including HTML views, PDF and ePub downloads, according to the available data) and Abstracts Views on Vision4Press platform.
Data correspond to usage on the plateform after 2015. The current usage metrics is available 48-96 hours after online publication and is updated daily on week days.
Initial download of the metrics may take a while.