Fig. 3.
Download original image
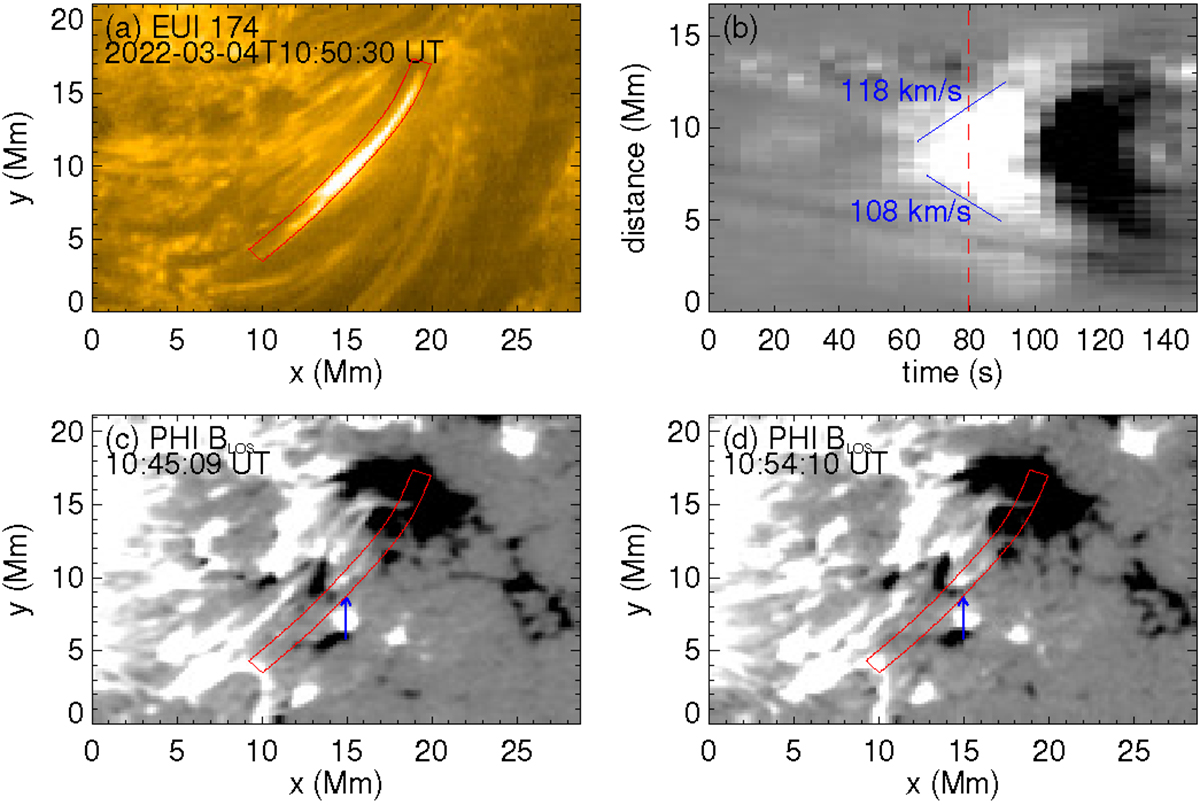
Coordinated observations of EUI and PHI of the first case observed on 2022 March 4. (a) Zoomed-in EUI 174 Å image taken at 10:50:30 on 2022 March 4. (b) Space-time diagram of the running difference images in EUI 174 Å passband along the slit shown in (a). The speeds are estimated through the slope of the blue lines. (c–d) Magnetograms saturated at ±350 G taken by PHI at 10:48:10 and 11:03:10 UT, respectively. The blue arrows point out the location of flux emergence and cancellation.
Current usage metrics show cumulative count of Article Views (full-text article views including HTML views, PDF and ePub downloads, according to the available data) and Abstracts Views on Vision4Press platform.
Data correspond to usage on the plateform after 2015. The current usage metrics is available 48-96 hours after online publication and is updated daily on week days.
Initial download of the metrics may take a while.