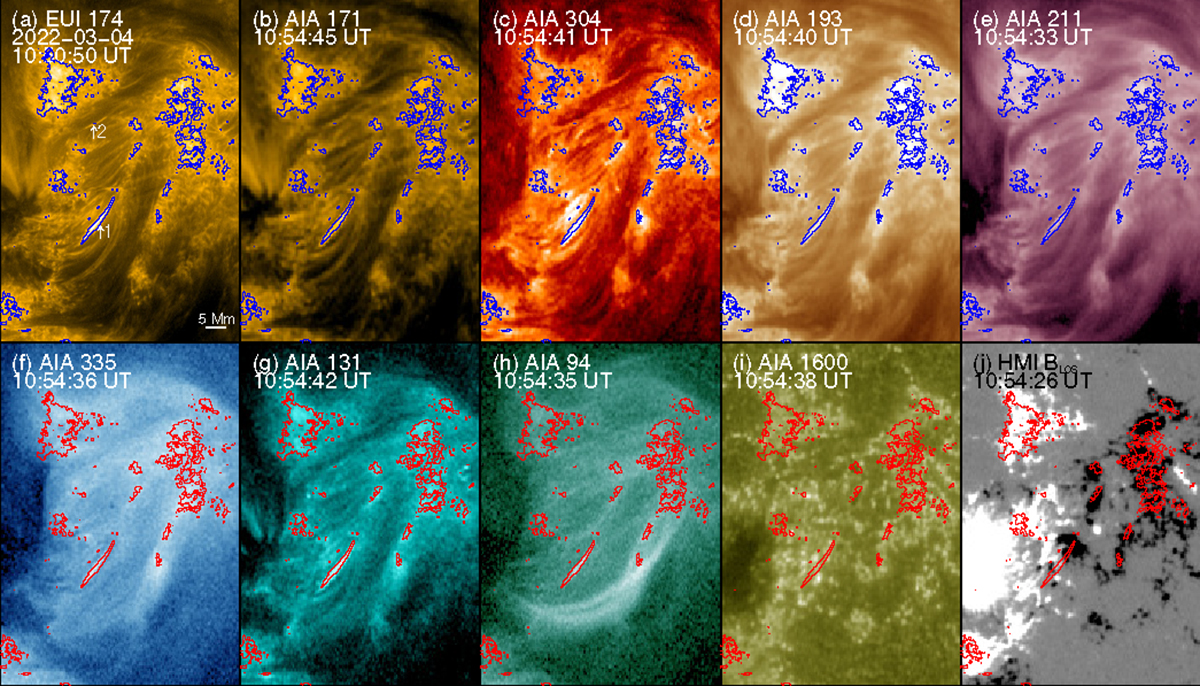
Fig. 2.
Download original image
Coordinated observations of AIA and HMI taken on 2022 March 4. (a) EUI 174 Å image taken at 10:50:50 UT. The two arrows indicate the two events shown in Figs. 3 and 5. (b–i) AIA 171, 304, 193, 211, 335, 131, 94, and 1600 Å images taken around 10:54 UT, respectively. (f) Magnetogram taken by HMI at 10:54:26 UT. The EUI and AIA images are shown in logarithm scales with arbitrary units, and the magnetogram is saturated at ±350 G. The contours outline the regions with enhanced EUI 174 Å emissions. An animation is available online, and the events are highlighted by arrows.
Current usage metrics show cumulative count of Article Views (full-text article views including HTML views, PDF and ePub downloads, according to the available data) and Abstracts Views on Vision4Press platform.
Data correspond to usage on the plateform after 2015. The current usage metrics is available 48-96 hours after online publication and is updated daily on week days.
Initial download of the metrics may take a while.