Fig. 5
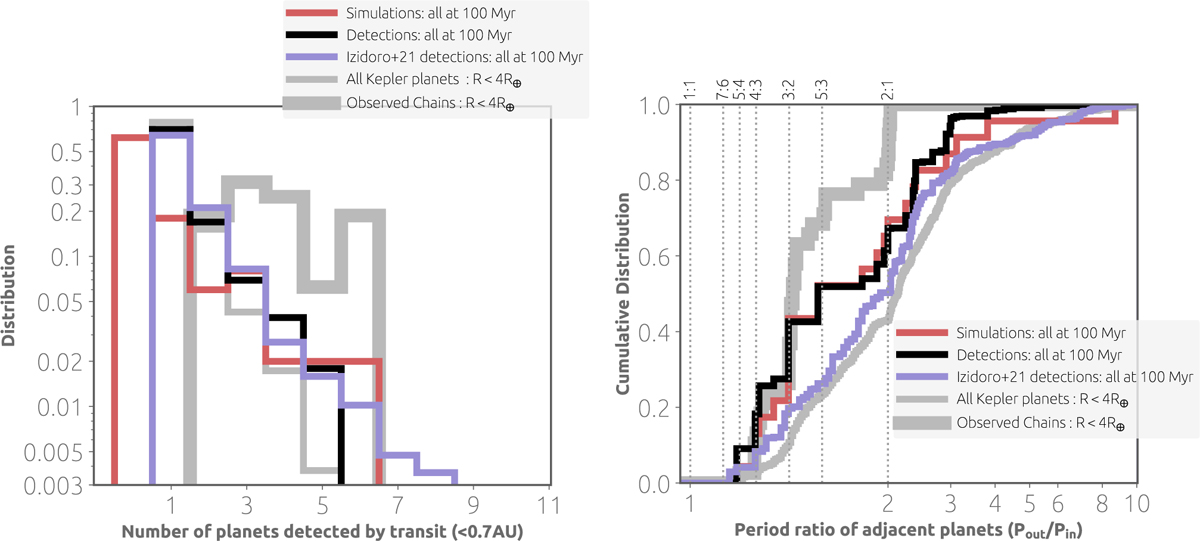
Download original image
Number of synthetically observed planets (left) and period ratios of adjacent planets (right) for the planetary systems after 100 Myr of integration; i.e. after the instability phase. The colours are the same as in Fig. 4. The high-viscosity simulations from Izidoro et al. (2021) produce wider systems after the instabilities compared to the low-viscosity simulations, which is also a consequence of the real number of planets in the systems before instabilities (left in Fig. 4), where more planets are initially present at high viscosities.
Current usage metrics show cumulative count of Article Views (full-text article views including HTML views, PDF and ePub downloads, according to the available data) and Abstracts Views on Vision4Press platform.
Data correspond to usage on the plateform after 2015. The current usage metrics is available 48-96 hours after online publication and is updated daily on week days.
Initial download of the metrics may take a while.