Fig. 4
Download original image
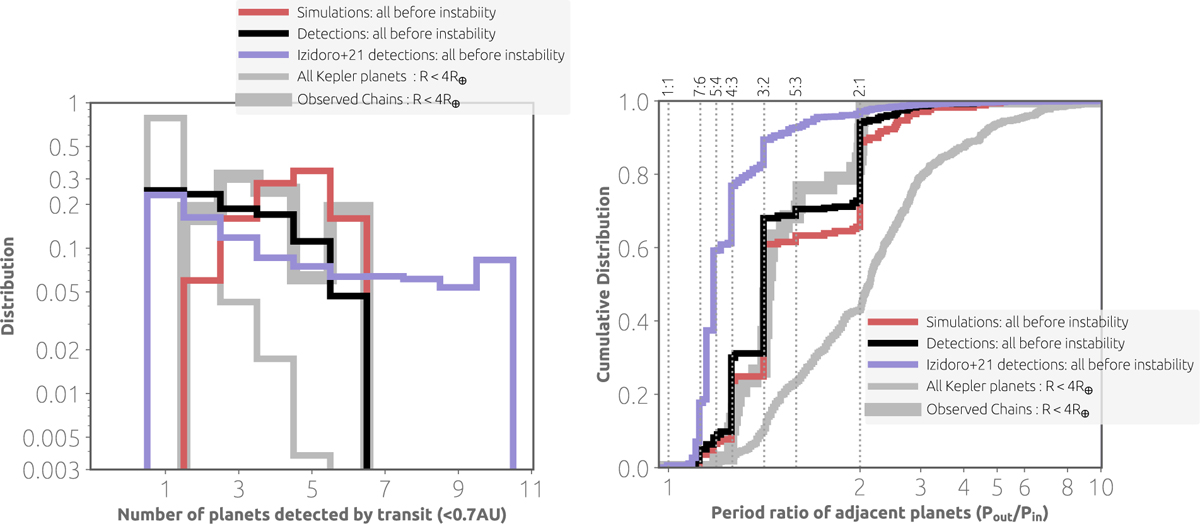
Number of synthetically observed planets (left) and period ratios of adjacent planets (right) for the planetary systems directly at the very end of the gas–disc phase, before the systems undergo instabilities. The thin grey line marks all the observations, while the thick grey line marks the observed chains of planets. The red colour corresponds to the direct results of our simulations, while the black line corresponds to the synthetical observations of our simulations. The purple line represents the synthetic observations from Izidoro et al. (2021). A clear difference is noted in the compactness of the chains between the high-viscosity simulations of Izidoro et al. (2021) and the low-viscosity simulations used here.
Current usage metrics show cumulative count of Article Views (full-text article views including HTML views, PDF and ePub downloads, according to the available data) and Abstracts Views on Vision4Press platform.
Data correspond to usage on the plateform after 2015. The current usage metrics is available 48-96 hours after online publication and is updated daily on week days.
Initial download of the metrics may take a while.