Fig. F.1
Download original image
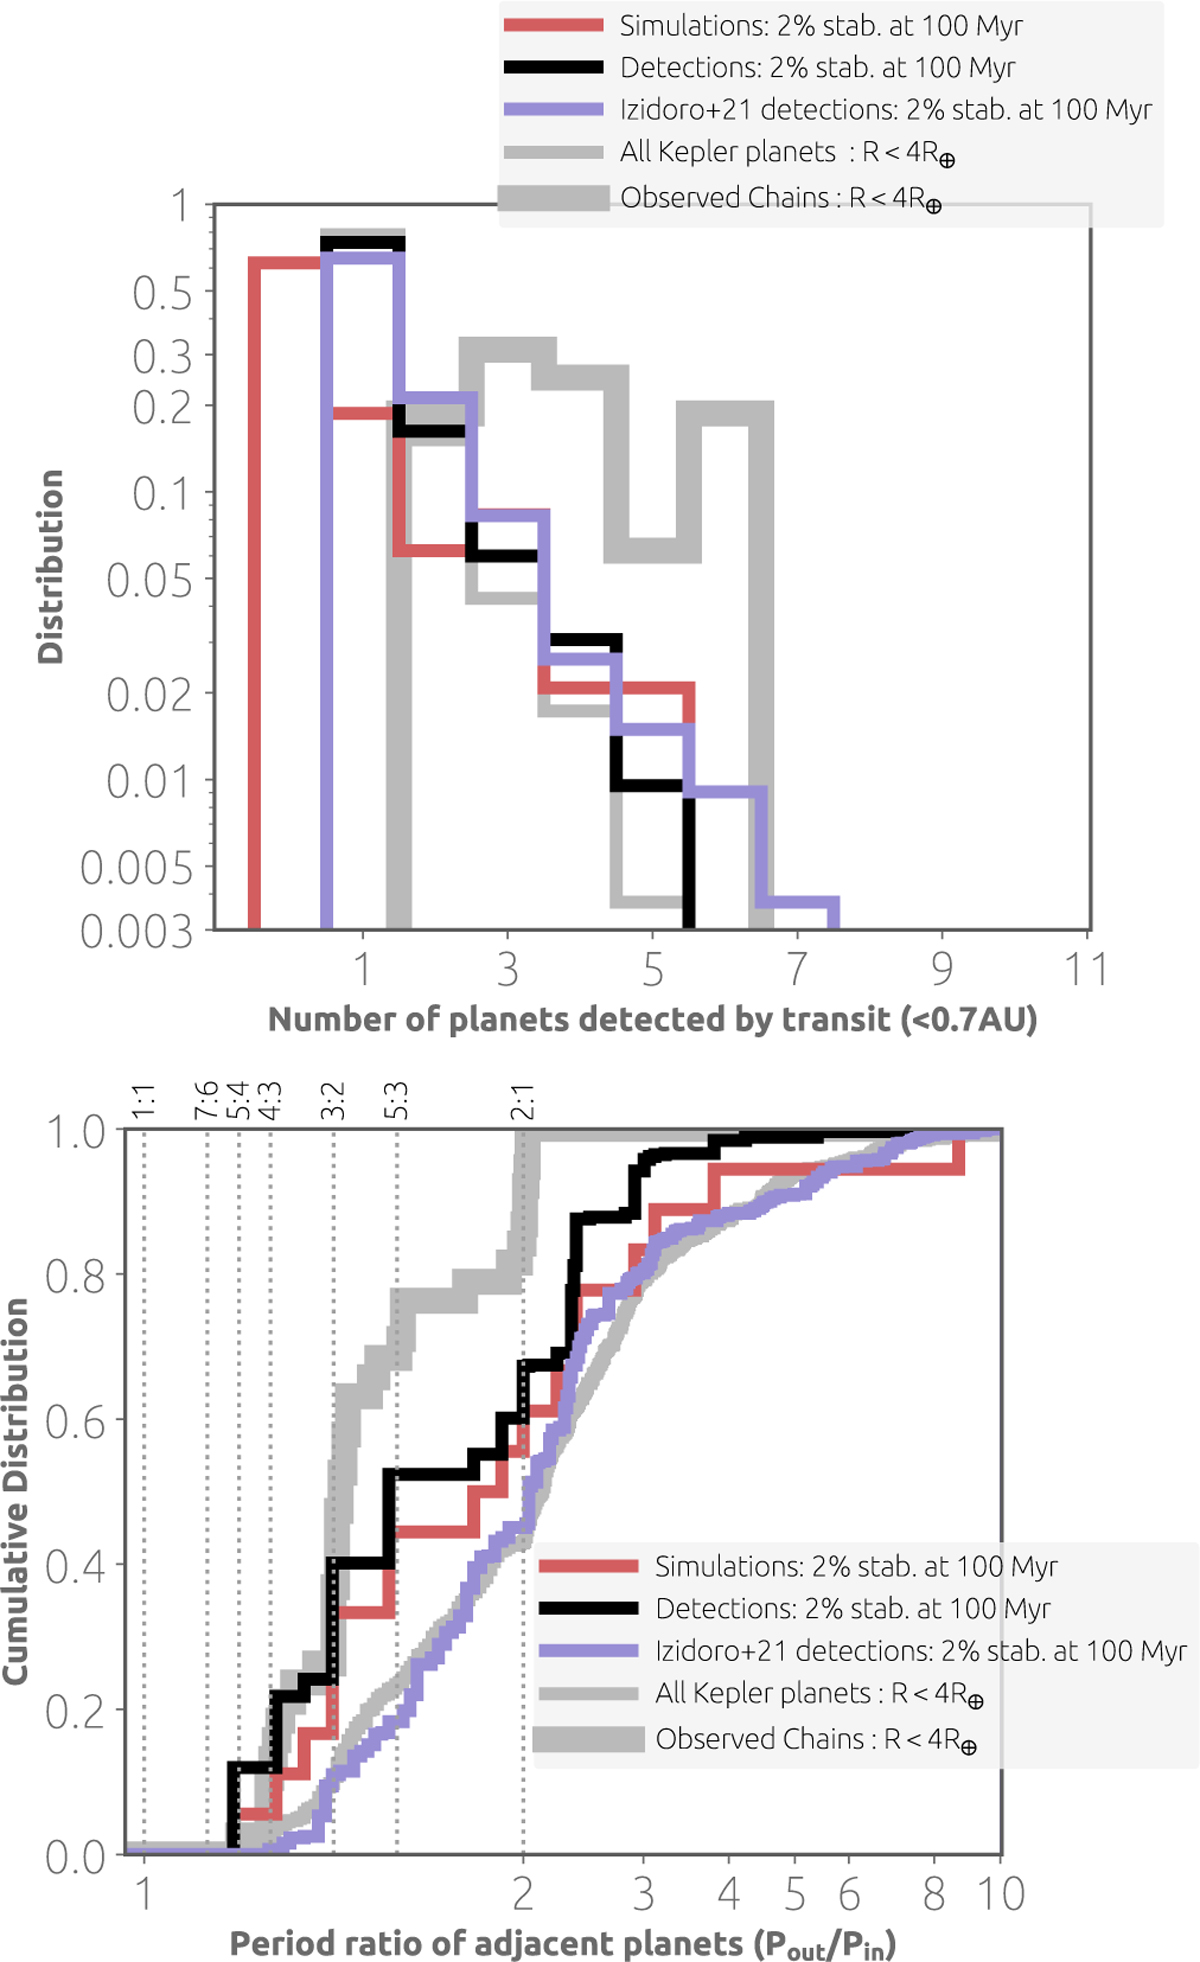
Number of synthetically observed planets from our simulations (top) and the period ratios of adjacent planets (bottom) for a mix of planetary systems that includes 2% stable chains and 98% systems that underwent instabilities. The colors are the same as in Fig. 4. Both sets of simulations give a nice match to the number of detected planets, but the period ratios are matched better in the high-viscosity case, compared to the low-viscosity case.
Current usage metrics show cumulative count of Article Views (full-text article views including HTML views, PDF and ePub downloads, according to the available data) and Abstracts Views on Vision4Press platform.
Data correspond to usage on the plateform after 2015. The current usage metrics is available 48-96 hours after online publication and is updated daily on week days.
Initial download of the metrics may take a while.