Fig. E.1
Download original image
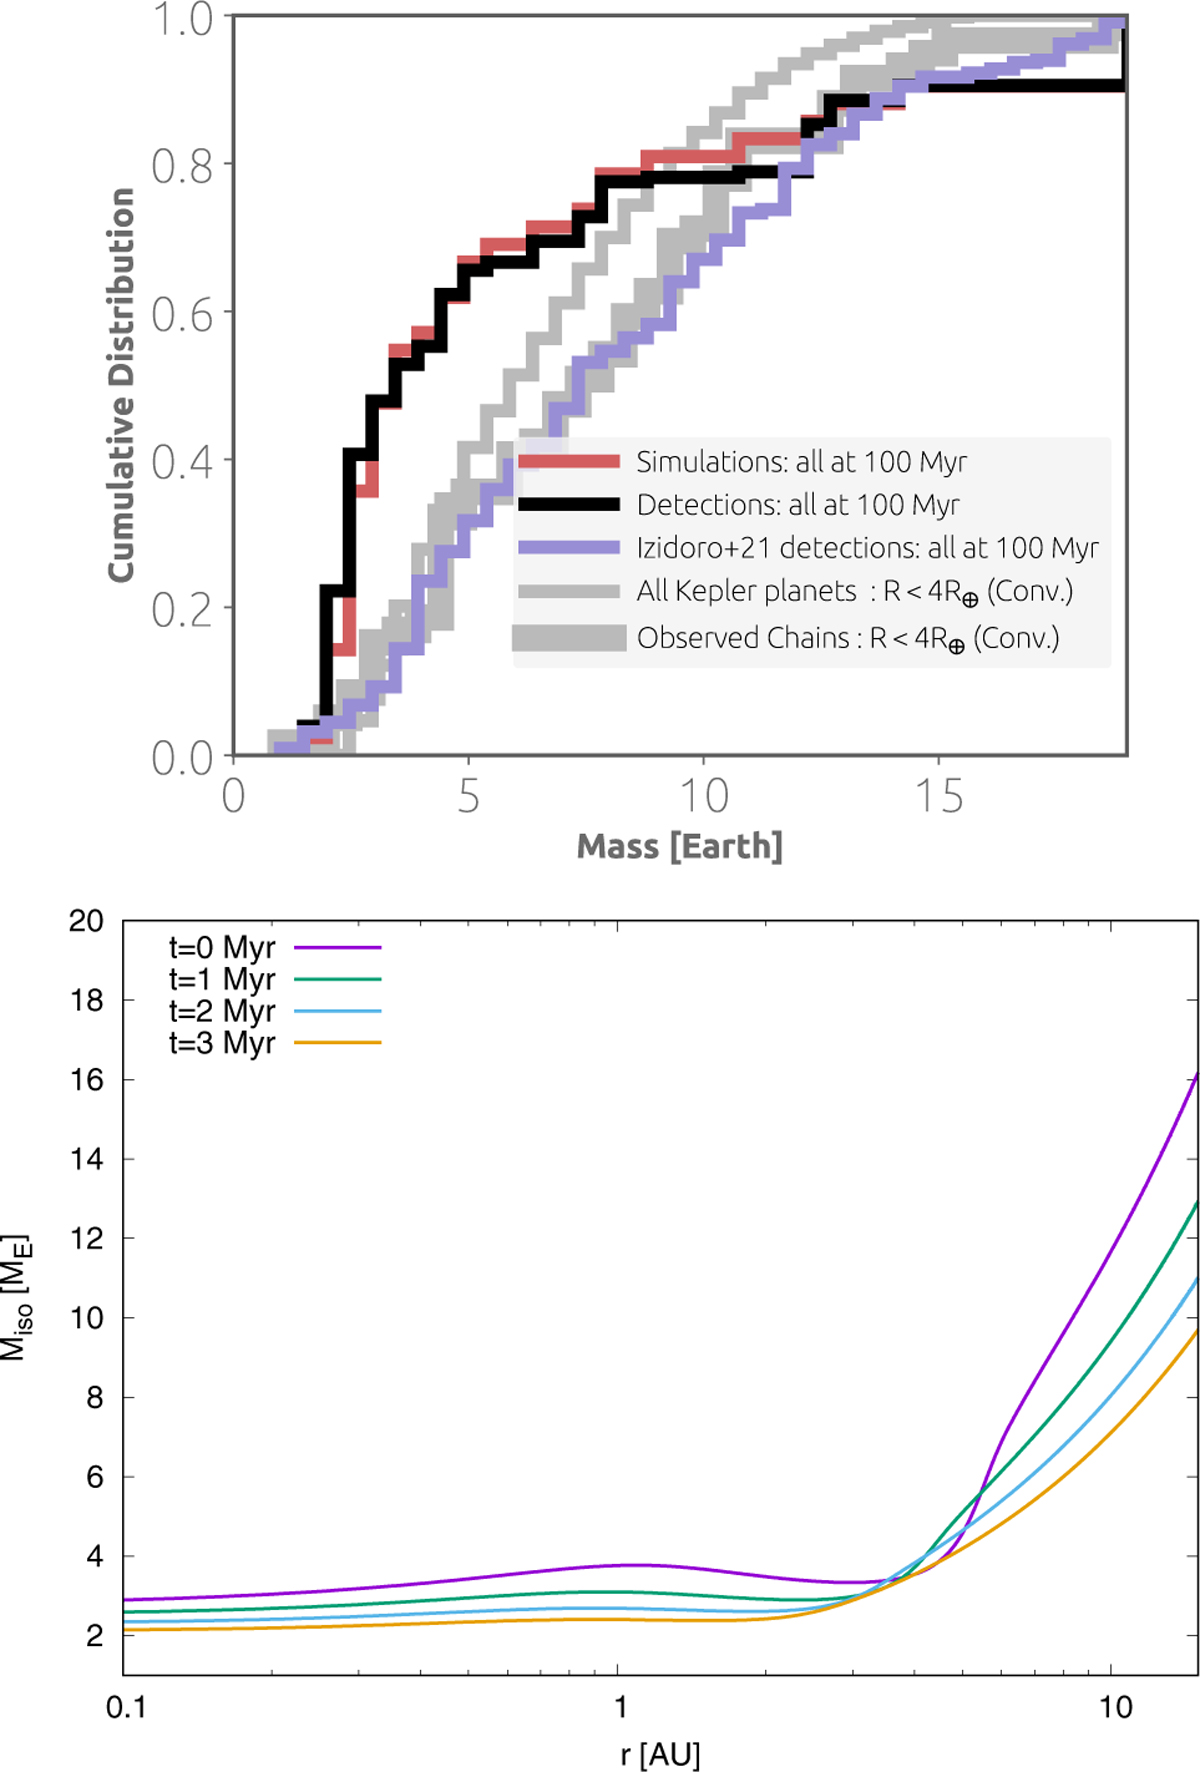
Top: Cumulative distribution of the planetary masses in our simulations (red) and their detections (black) as well as from the simulations of Izidoro et al. (2021) (purple) after 100 Myr of integration time. We also overplot the masses from the Kepler observations using the mass-radius relationship of Wolfgang et al. (2016). Bottom: Time evolution of the pebble isolation mass in our model, following the recipe of Bitsch et al. (2018b). Here t = 0 corresponds to the starting time of the simulations, so to a disc that is already 2 Myr old in the framework of Bitsch et al. (2015a).
Current usage metrics show cumulative count of Article Views (full-text article views including HTML views, PDF and ePub downloads, according to the available data) and Abstracts Views on Vision4Press platform.
Data correspond to usage on the plateform after 2015. The current usage metrics is available 48-96 hours after online publication and is updated daily on week days.
Initial download of the metrics may take a while.