Open Access
Fig. D.2
Download original image
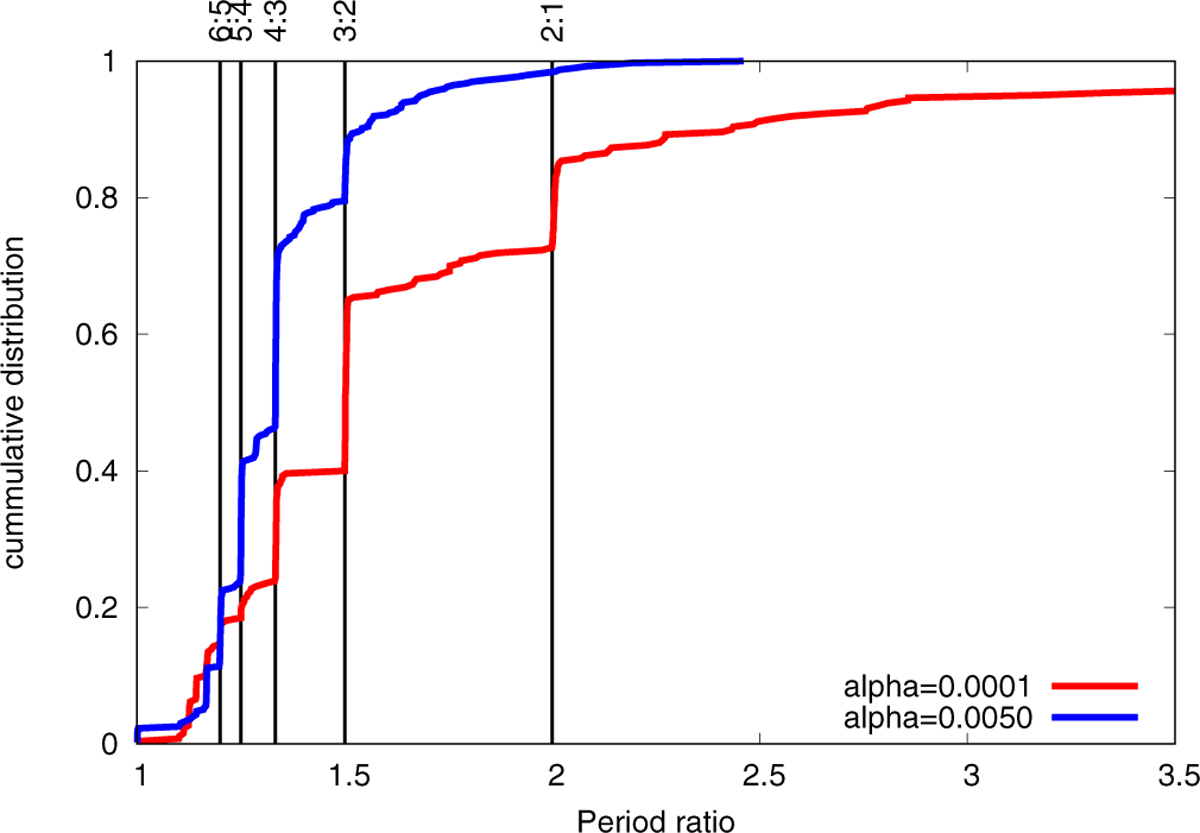
Period ratios of the planets interior to 1.0 AU for our simulations using α = 10−4 and a comparison sample with the same disc properties, but α = 5 × 10⁻³. The resulting periods are plotted after the end of the gas disc phase at 3 Myr.
Current usage metrics show cumulative count of Article Views (full-text article views including HTML views, PDF and ePub downloads, according to the available data) and Abstracts Views on Vision4Press platform.
Data correspond to usage on the plateform after 2015. The current usage metrics is available 48-96 hours after online publication and is updated daily on week days.
Initial download of the metrics may take a while.