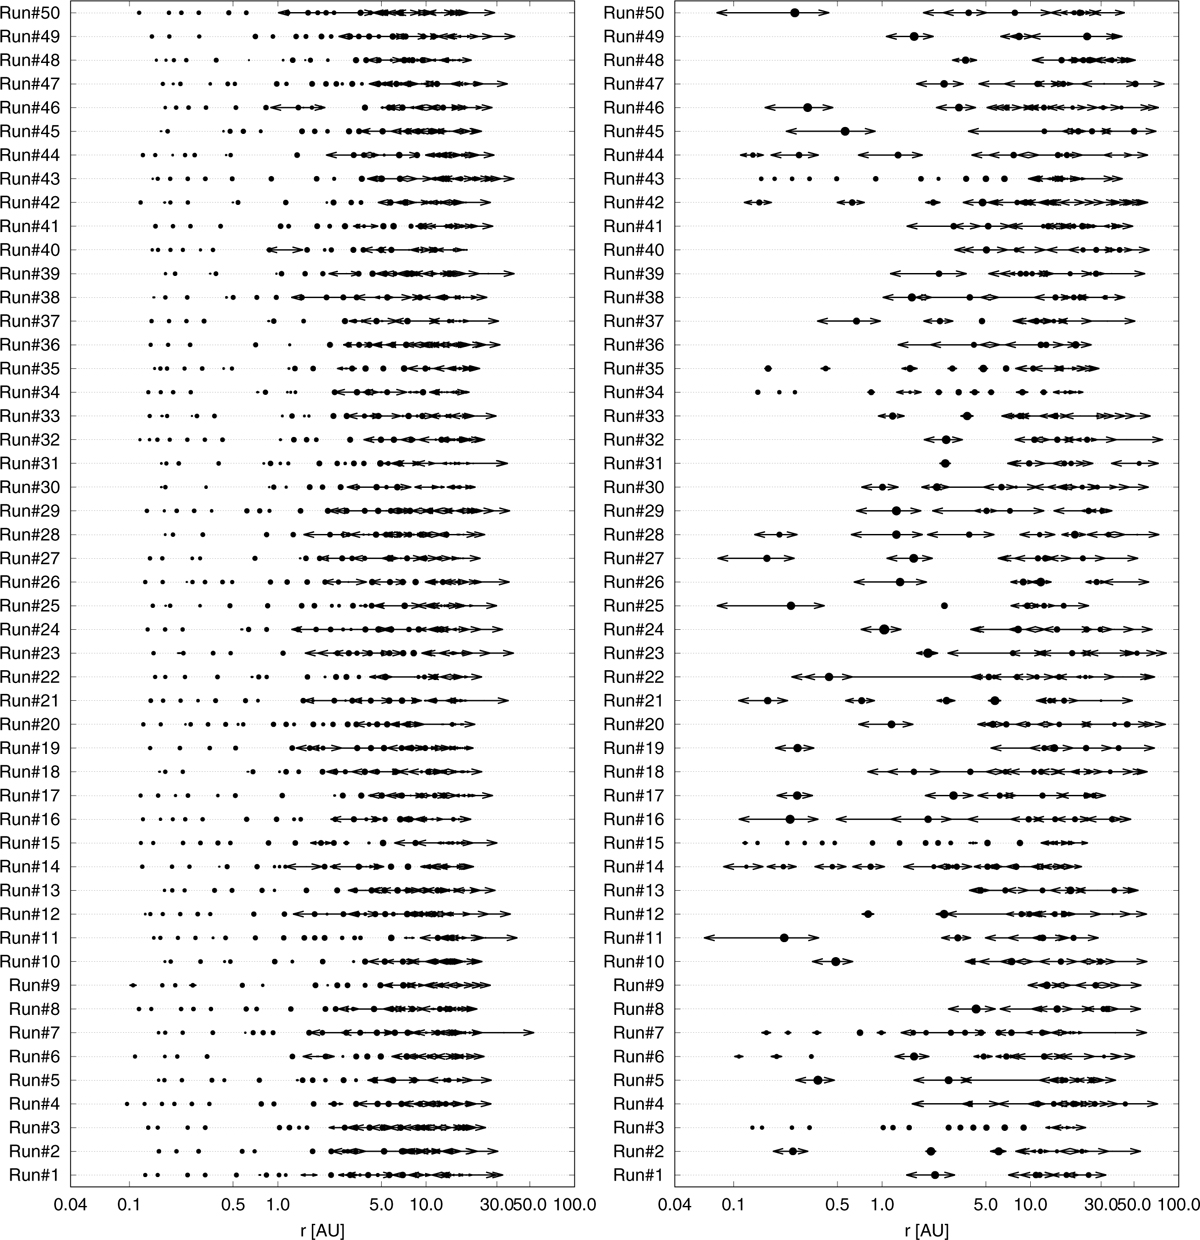
Fig. C.1
Download original image
Systems formed in our low-viscosity simulations after the gas–disc phase (left) and after 100 Myr of integration (right). The size of the dots is proportional to the planetary mass, while the arrow marks the aphelion and perihelion of the corresponding planet. We note that the synthetic observations only take planets up until 0.7 AU into account.
Current usage metrics show cumulative count of Article Views (full-text article views including HTML views, PDF and ePub downloads, according to the available data) and Abstracts Views on Vision4Press platform.
Data correspond to usage on the plateform after 2015. The current usage metrics is available 48-96 hours after online publication and is updated daily on week days.
Initial download of the metrics may take a while.