Fig. 14
Download original image
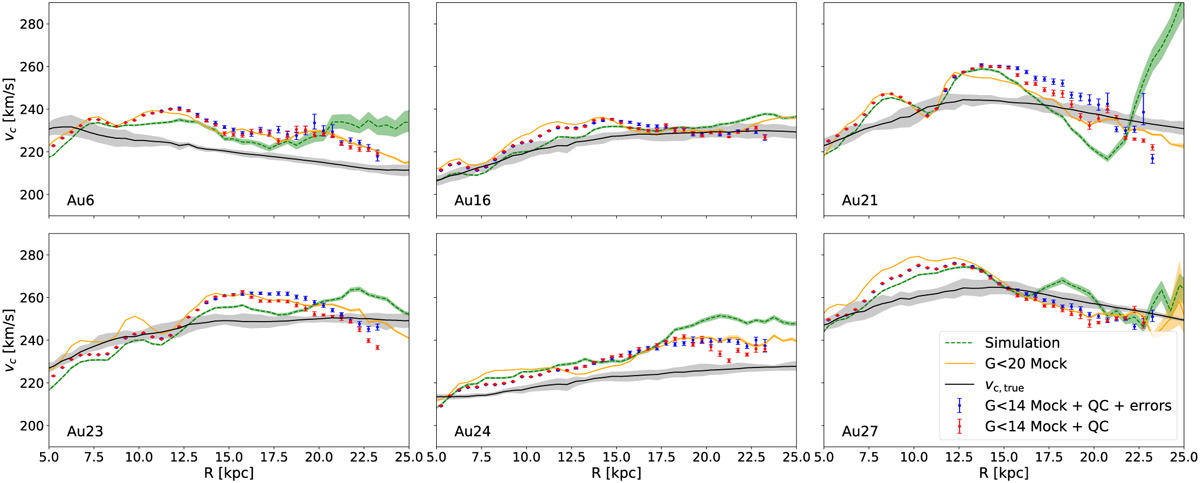
Jeans derived υc for the six Aurigaia mocks from Grand et al. (2018). The green dashed line with shaded region shows the result for the simulation particles. The orange line shows the result for the full mock catalogue with only a magnitude limit at G < 20. The red points show the results for the full mock with our data quality cuts. The blue points show the result for the observed mock sample. This is the sample shown in Fig. 13 and described in Table 3. The black line and shaded region show υc,true and its associated 1σ variation.
Current usage metrics show cumulative count of Article Views (full-text article views including HTML views, PDF and ePub downloads, according to the available data) and Abstracts Views on Vision4Press platform.
Data correspond to usage on the plateform after 2015. The current usage metrics is available 48-96 hours after online publication and is updated daily on week days.
Initial download of the metrics may take a while.