Fig. 12
Download original image
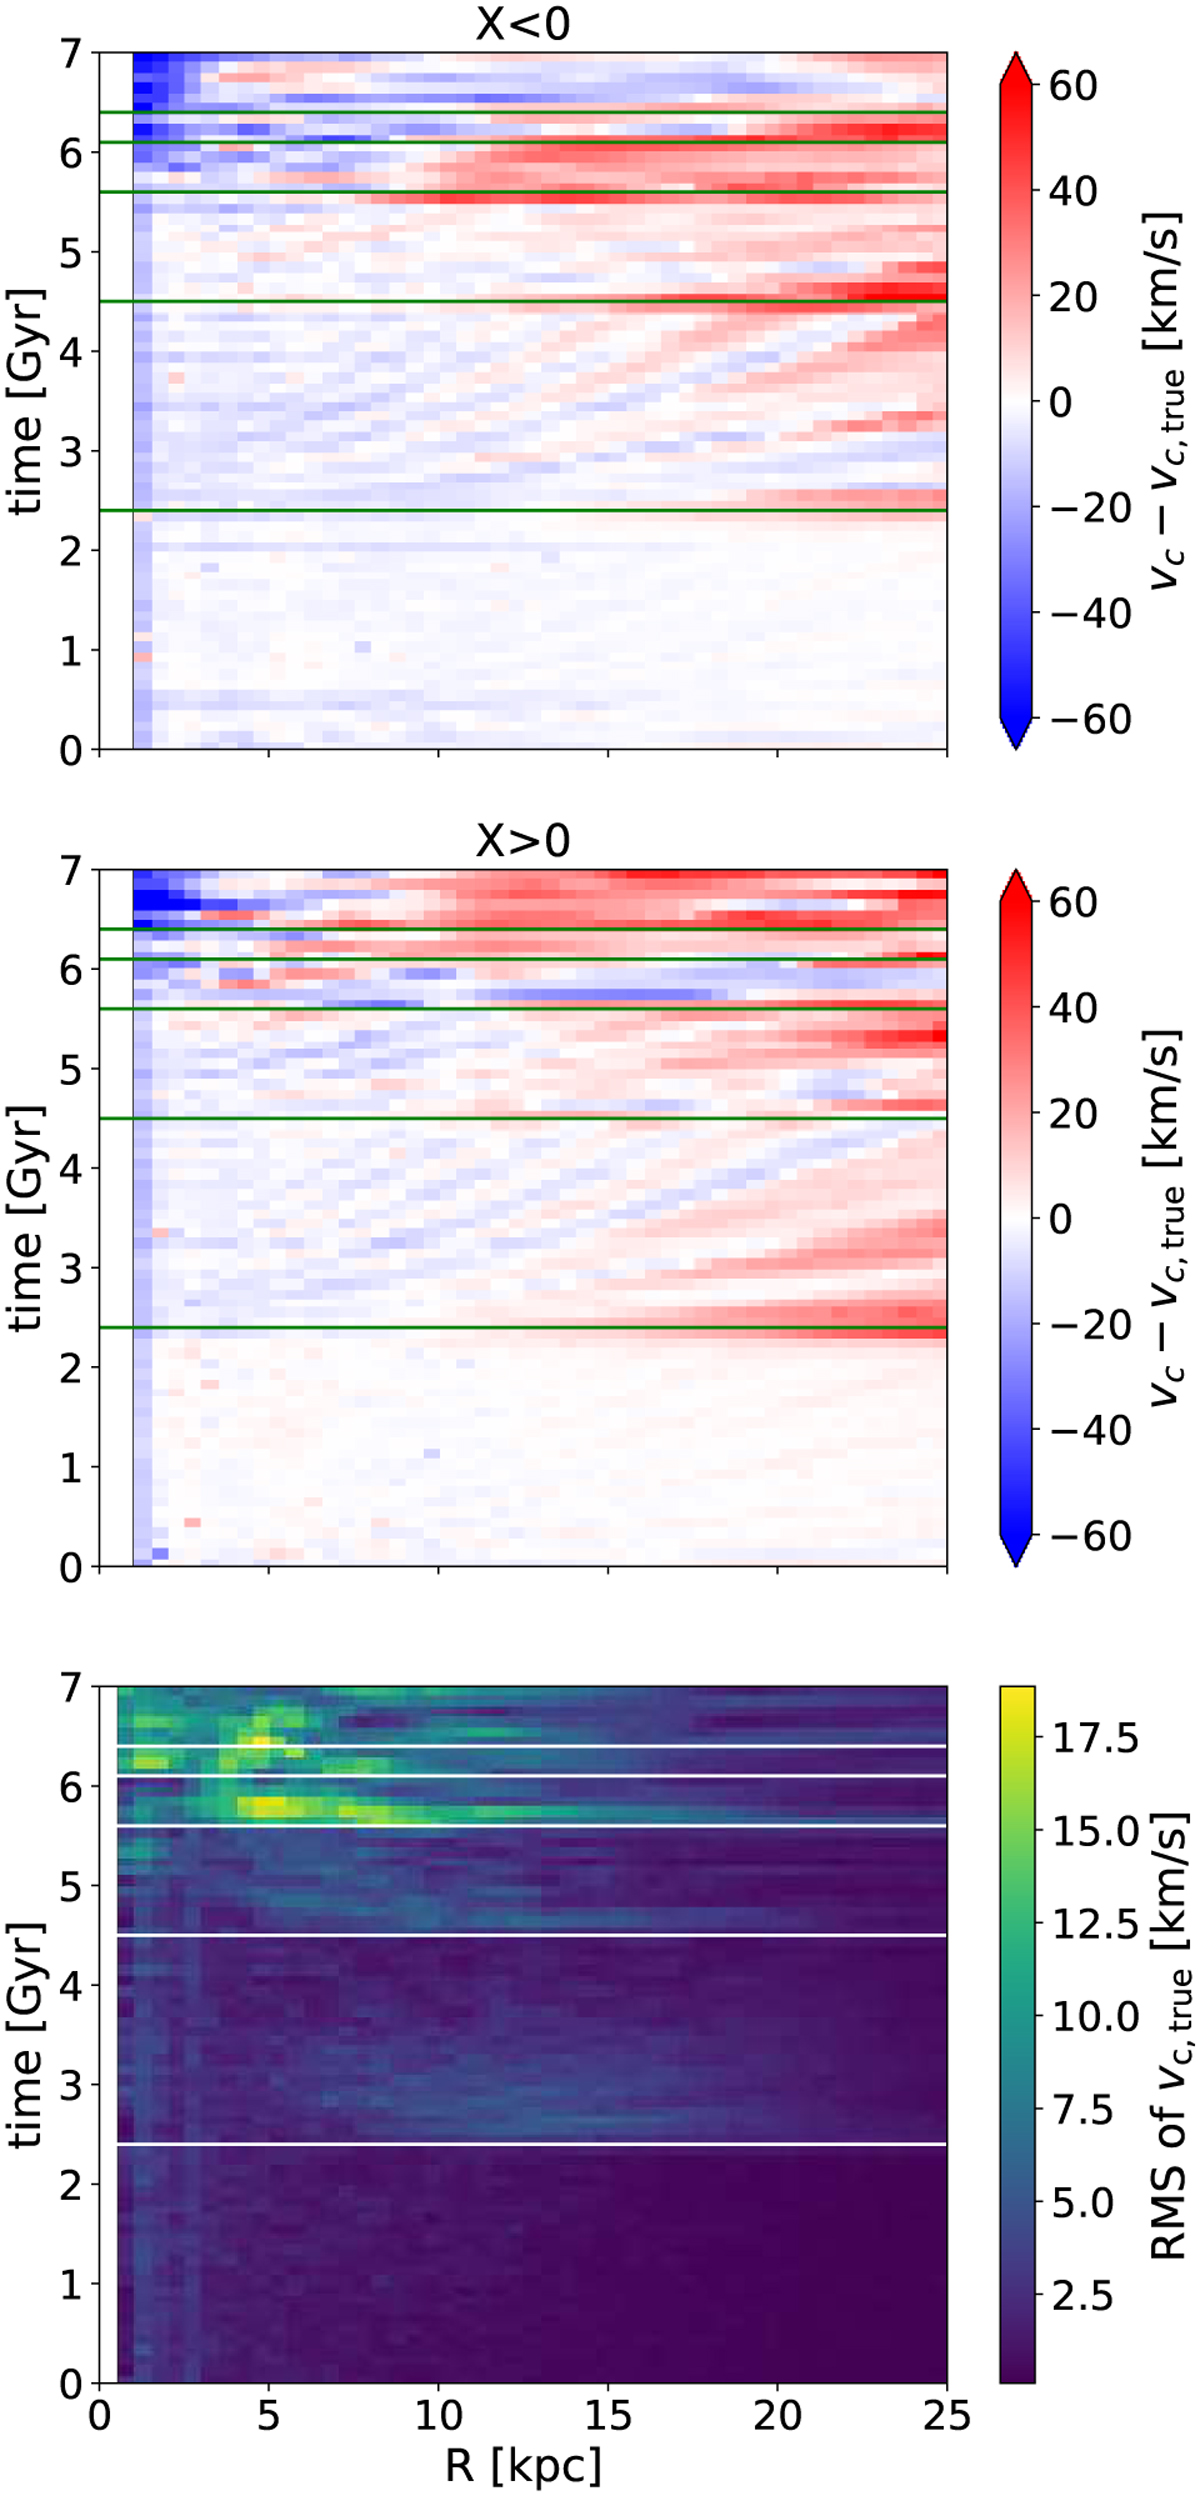
Time-evolution of υc in the simulation from Laporte et al. (2018). Top and middle: the difference between the Jeans equation derived υc and the true υc,true. The top panel shows the result for x < 0 and the middle panel shows the opposite side of the disc (x > 0). Bottom: the RMS of υctrue with azimuth. Green (white) horizontal lines show the pericentres of the satellite. The start of the simulation is at t = 0.
Current usage metrics show cumulative count of Article Views (full-text article views including HTML views, PDF and ePub downloads, according to the available data) and Abstracts Views on Vision4Press platform.
Data correspond to usage on the plateform after 2015. The current usage metrics is available 48-96 hours after online publication and is updated daily on week days.
Initial download of the metrics may take a while.