Fig. 11
Download original image
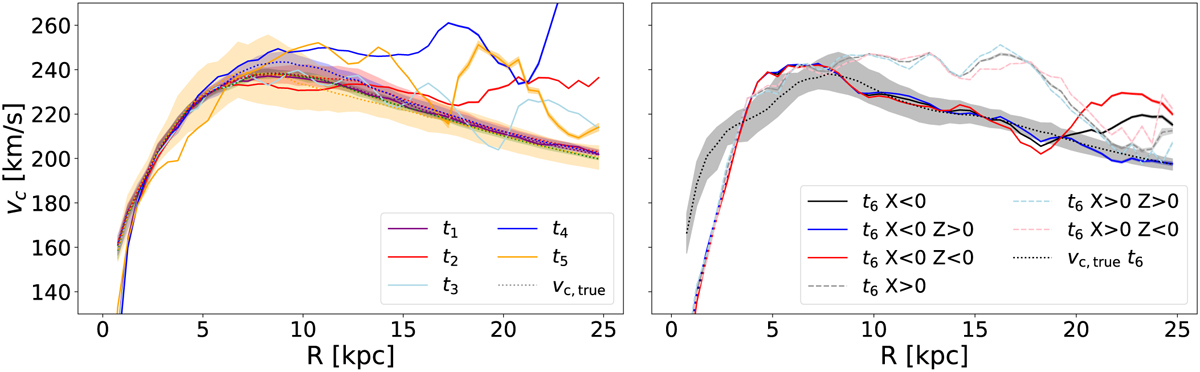
υc calculated for the different snapshots in simulation L2 from Laporte et al. (2018). The dotted lines show the azimuthally averaged value of υc,true, with the shaded region showing the 1σ quantiles of the intrinsic variation. The left panel shows t{1,2,3,4,5}, corresponding to the top row of Fig. 10. The right panel corresponds to the bottom row of Fig. 10, showing the results for t6 in different slices for x ≶ 0 and ɀ ≶ 0.
Current usage metrics show cumulative count of Article Views (full-text article views including HTML views, PDF and ePub downloads, according to the available data) and Abstracts Views on Vision4Press platform.
Data correspond to usage on the plateform after 2015. The current usage metrics is available 48-96 hours after online publication and is updated daily on week days.
Initial download of the metrics may take a while.