Open Access
Fig. 10
Download original image
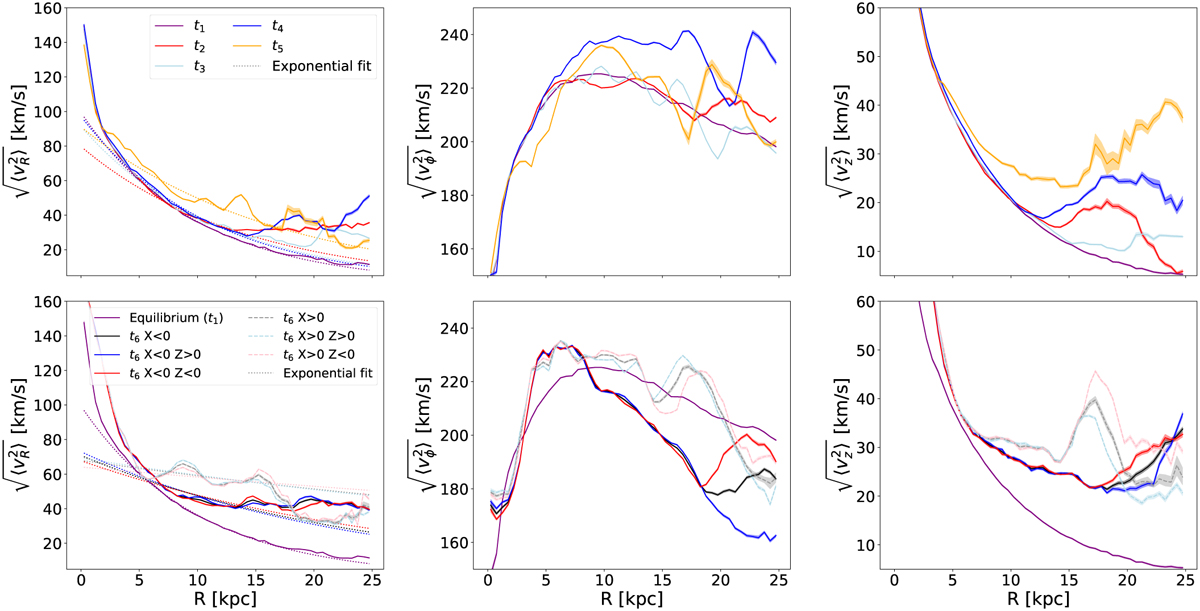
Radial profiles of the three second moments of the velocity distribution in simulation L2 from Laporte et al. (2018). The top row shows t{1,2,3,4,5}. The bottom row shows t6 for both sides of the disc in x ≶ 0 and vertical cuts in ɀ ≶ 0, along with the equilibrium situation at t1 for reference.
Current usage metrics show cumulative count of Article Views (full-text article views including HTML views, PDF and ePub downloads, according to the available data) and Abstracts Views on Vision4Press platform.
Data correspond to usage on the plateform after 2015. The current usage metrics is available 48-96 hours after online publication and is updated daily on week days.
Initial download of the metrics may take a while.