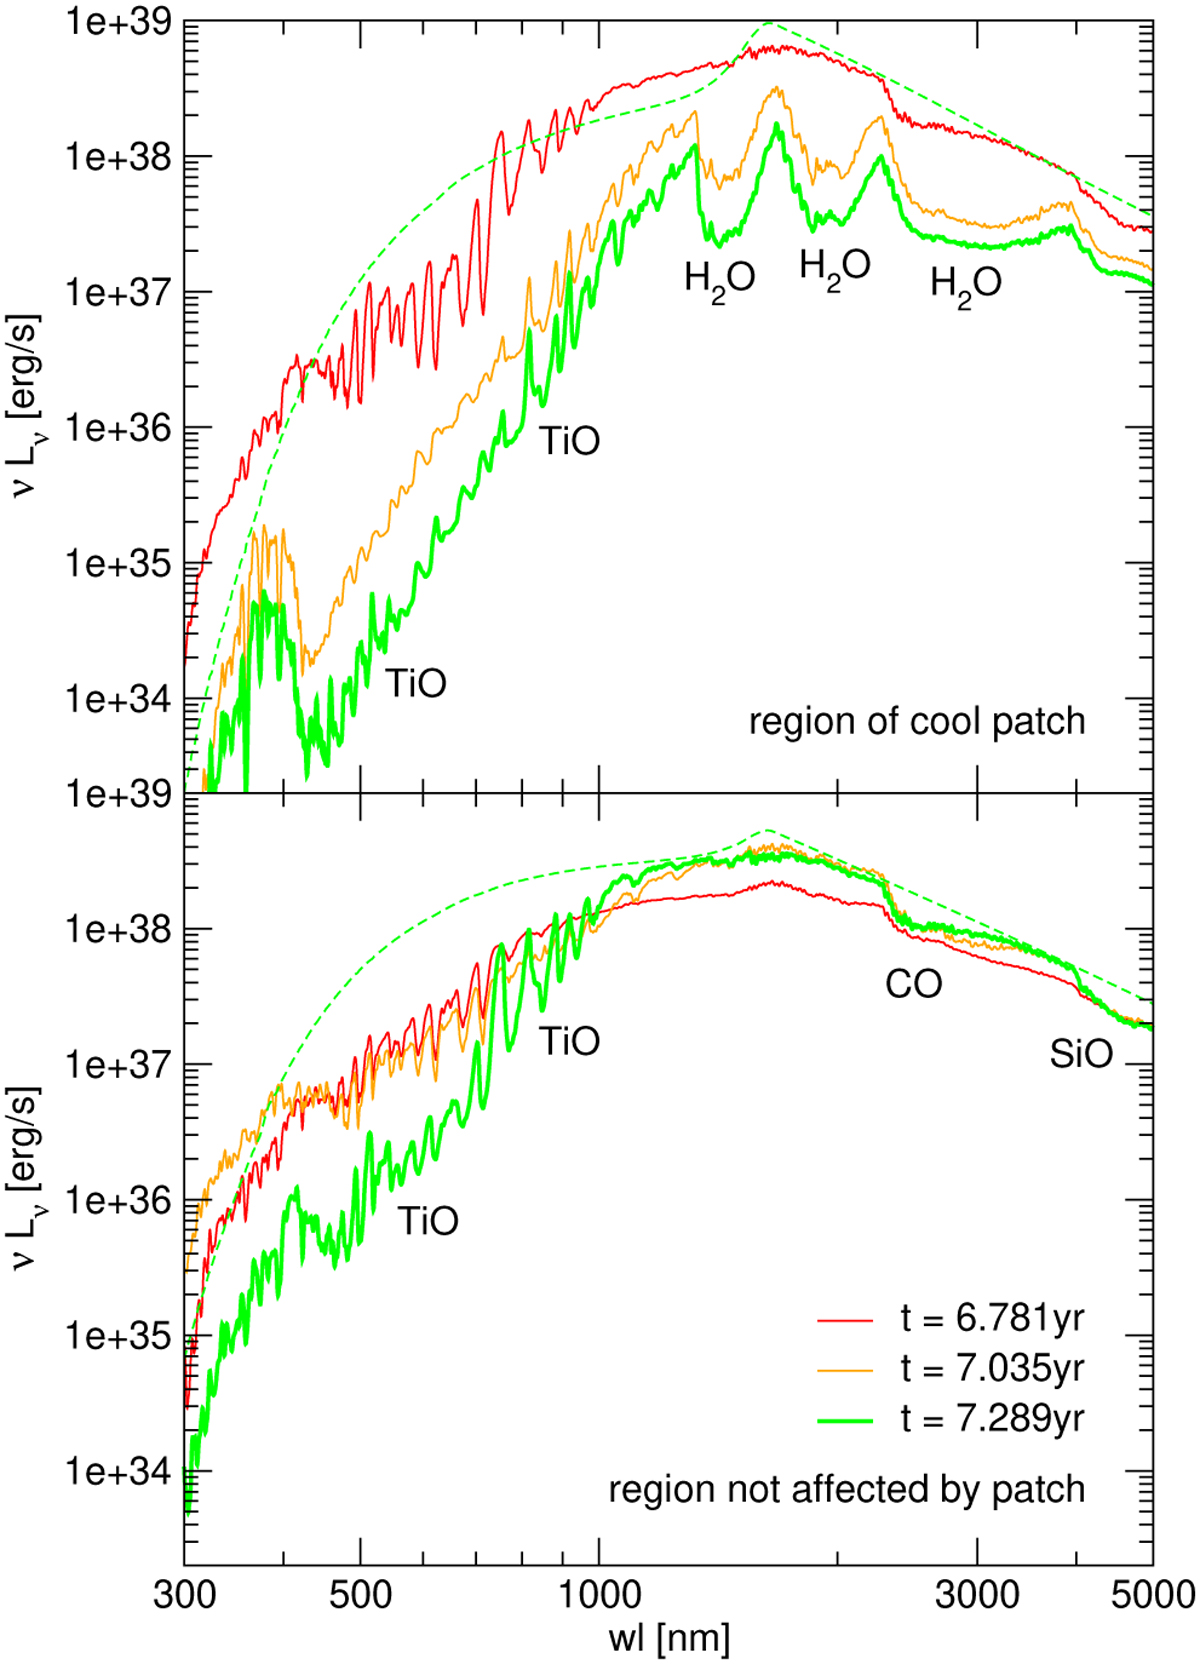
Fig. 9
Download original image
Low-resolution (R=200) 1D spectra based on the 5 M⊙ model st35gm04n045. The results shown were computed along rays from the stellar center passing through a certain spot on the surface. The energy distributions in the upper panel correspond to the radial structures and time steps displayed in Fig. 6 (rays in the third row of Fig. 4), which represent the region of the dark patch. The spectra in the lower panel covering the same epochs are typical for areas not affected by the local cooling. They were computed for horizontal rays in Fig. 4. All displayed intensities correspond to an expansion of the fluxes to a uniform disk with the size of the star. The dashed line represents the continuum obtained by neglecting all atomic and molecular transitions for the last time step. The most important molecular features have been indicated.
Current usage metrics show cumulative count of Article Views (full-text article views including HTML views, PDF and ePub downloads, according to the available data) and Abstracts Views on Vision4Press platform.
Data correspond to usage on the plateform after 2015. The current usage metrics is available 48-96 hours after online publication and is updated daily on week days.
Initial download of the metrics may take a while.