Fig. 8
Download original image
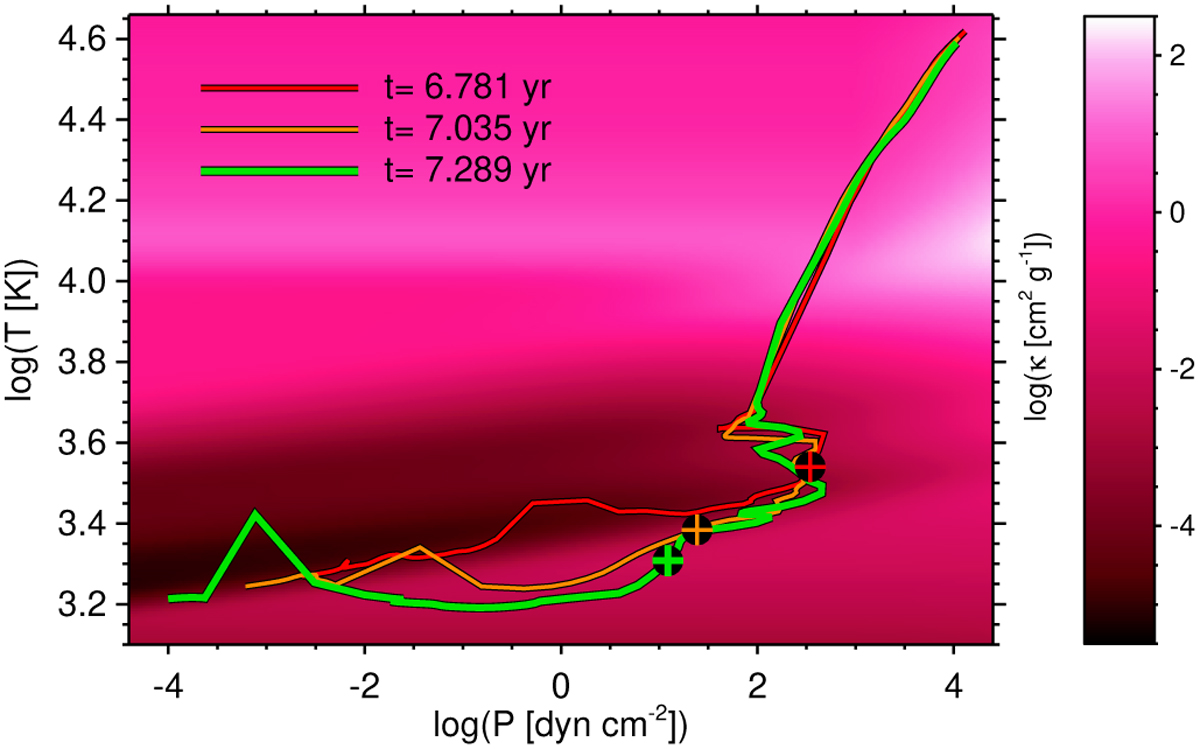
Logarithm of Rosseland opacity per mass unit [cm2 g−1] as a function of the logarithm of pressure and logarithm of temperature with overlaid 1D profiles from Fig. 6. The color table is the same as for the opacity-per-gram panel in Fig. 4. The plus signs mark the position of optical depth unity (τRoss = 1), integrated along the ray.
Current usage metrics show cumulative count of Article Views (full-text article views including HTML views, PDF and ePub downloads, according to the available data) and Abstracts Views on Vision4Press platform.
Data correspond to usage on the plateform after 2015. The current usage metrics is available 48-96 hours after online publication and is updated daily on week days.
Initial download of the metrics may take a while.