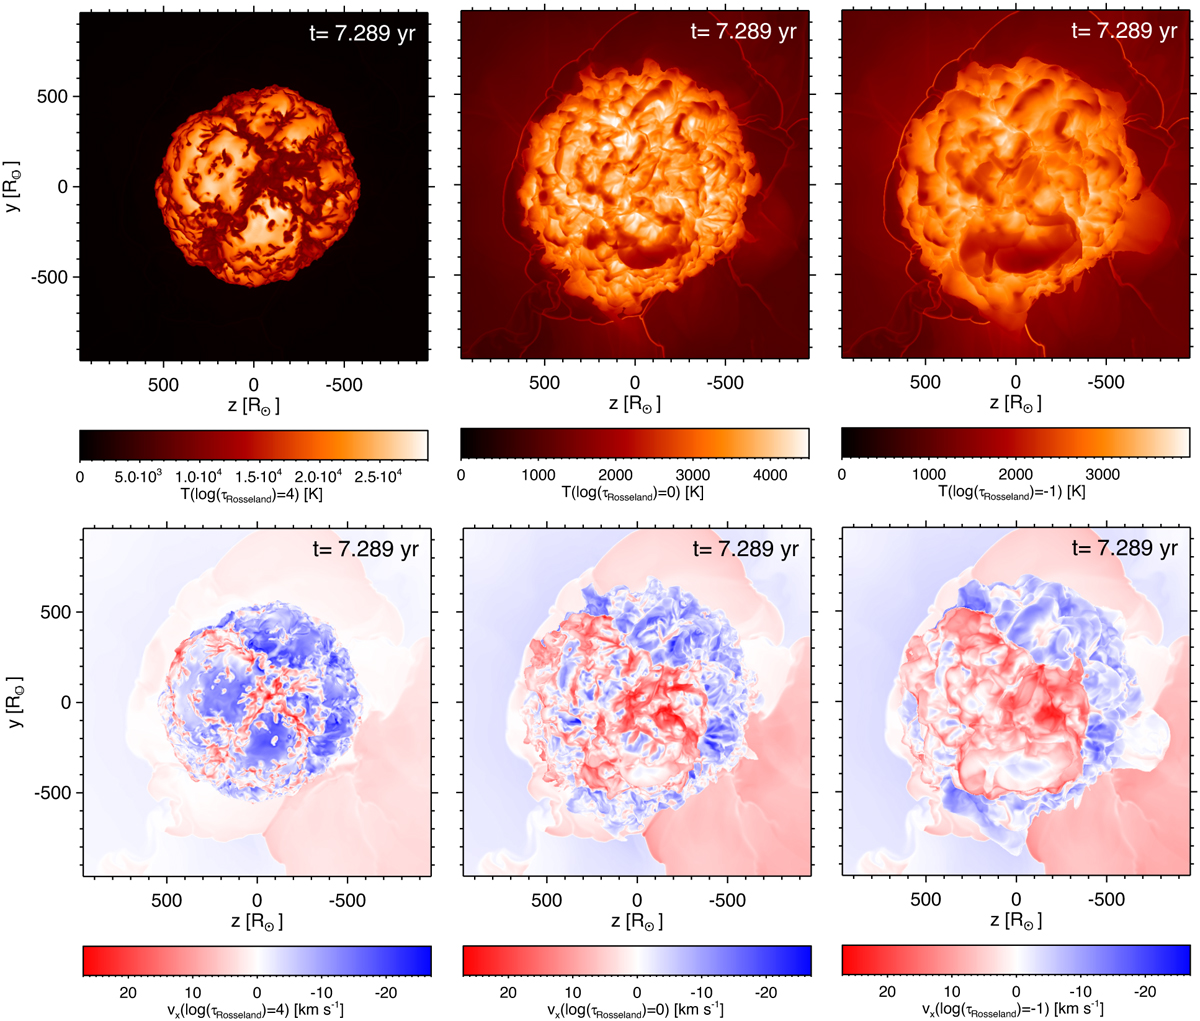
Fig. 7
Download original image
Temperatures (top row) and line-of-sight velocities (bottom row, blue indicates motion toward the observer) at optical depths log(τRoss) = 4, 0, and −1 (from left to right) for the 5 M⊙ model st35gm04n045. At points with an optical depths lower than the nominal value, the value at the rear boundary is plotted. The signature of the cool material causing the dark horizontal patch developing on the lower hemisphere is visible around y = −400 R⊙, z = 0 at log(τRoss) = 0 and -1. The view (axes y and z) corresponds to the intensity maps in Fig. 2.
Current usage metrics show cumulative count of Article Views (full-text article views including HTML views, PDF and ePub downloads, according to the available data) and Abstracts Views on Vision4Press platform.
Data correspond to usage on the plateform after 2015. The current usage metrics is available 48-96 hours after online publication and is updated daily on week days.
Initial download of the metrics may take a while.