Fig. 4
Download original image
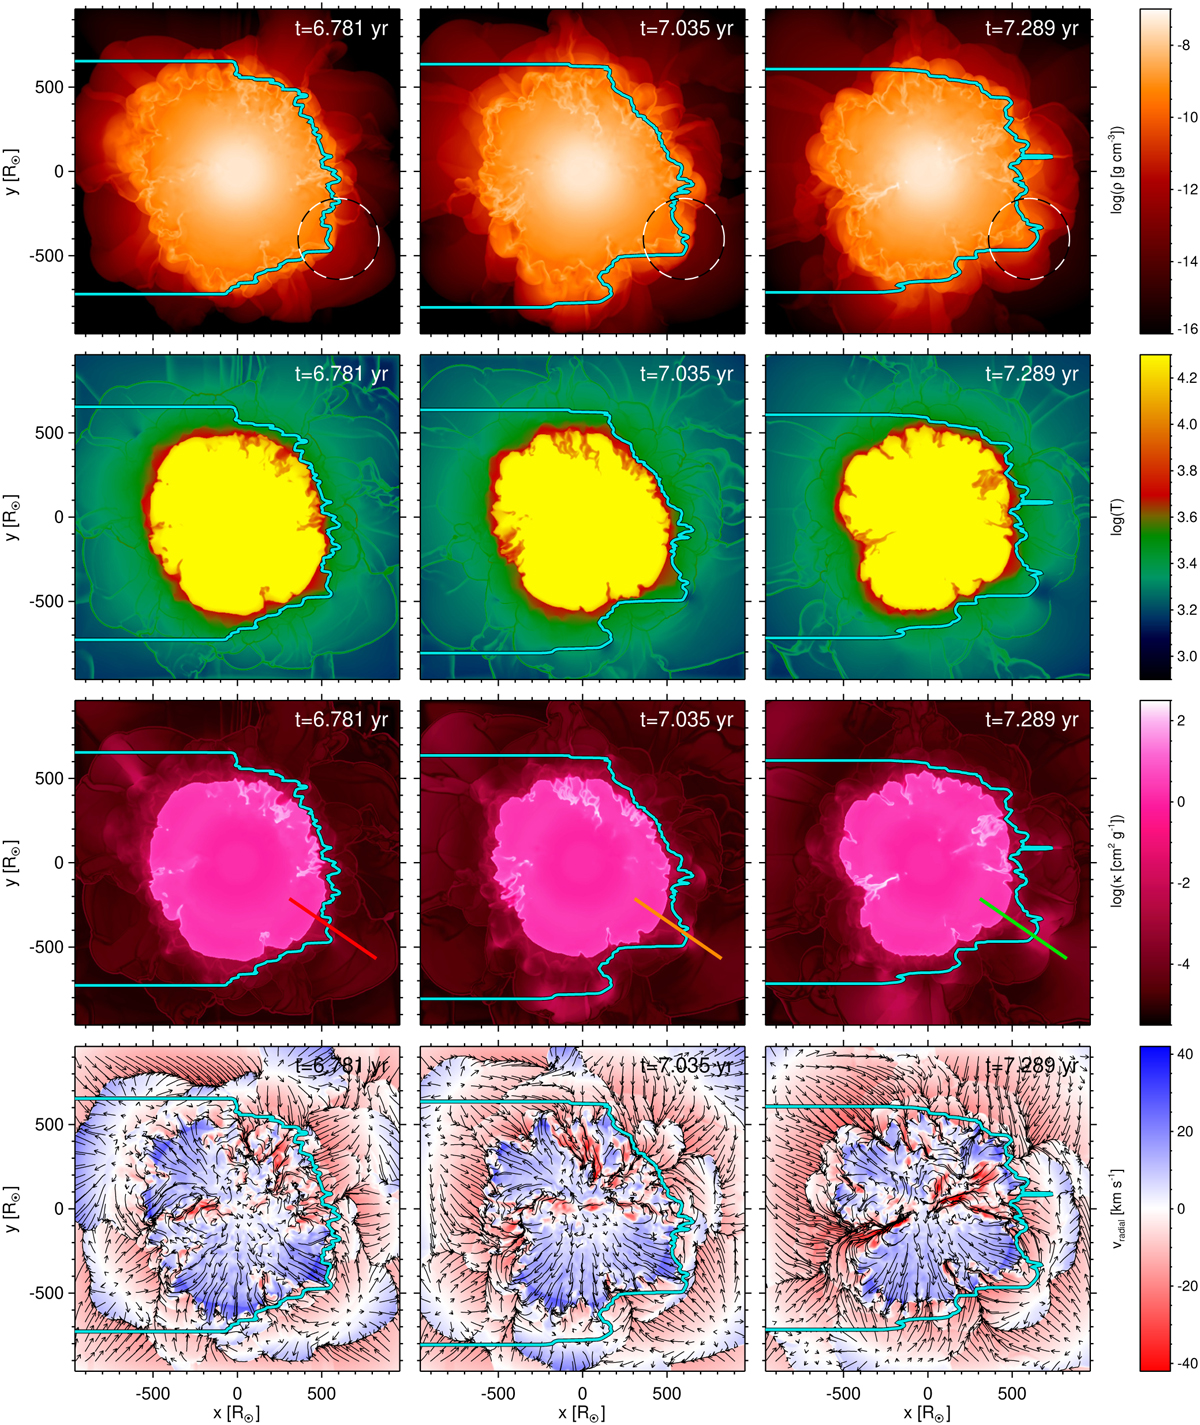
Time sequences of cross sections through the center of the 5 M⊙ model st35gm04n045 showing the logarithm of density, the logarithm of temperature (scale restricted to values below T = 20 000 K to better display the conditions within the atmosphere), the logarithm of opacity (per gram) with colored lines (red, orange, green) indicating the spatial positions of the radial profiles in Fig. 6, and the radial velocity with overlaid pseudo-streamlines. The view (axes x and y) corresponds to the one in the middle row of Fig. 3 with the dashed-line circle marking the main region of interest. The cyan contour line indicates gray optical depth unity (τRoss = 1) for an observer located to the right. The cool, dense material causing the dark patch or emission region in Fig. 2 is seen from the side at 4 o’clock, causing the extension of the τRoss contour line to the right.
Current usage metrics show cumulative count of Article Views (full-text article views including HTML views, PDF and ePub downloads, according to the available data) and Abstracts Views on Vision4Press platform.
Data correspond to usage on the plateform after 2015. The current usage metrics is available 48-96 hours after online publication and is updated daily on week days.
Initial download of the metrics may take a while.