Fig. 3
Download original image
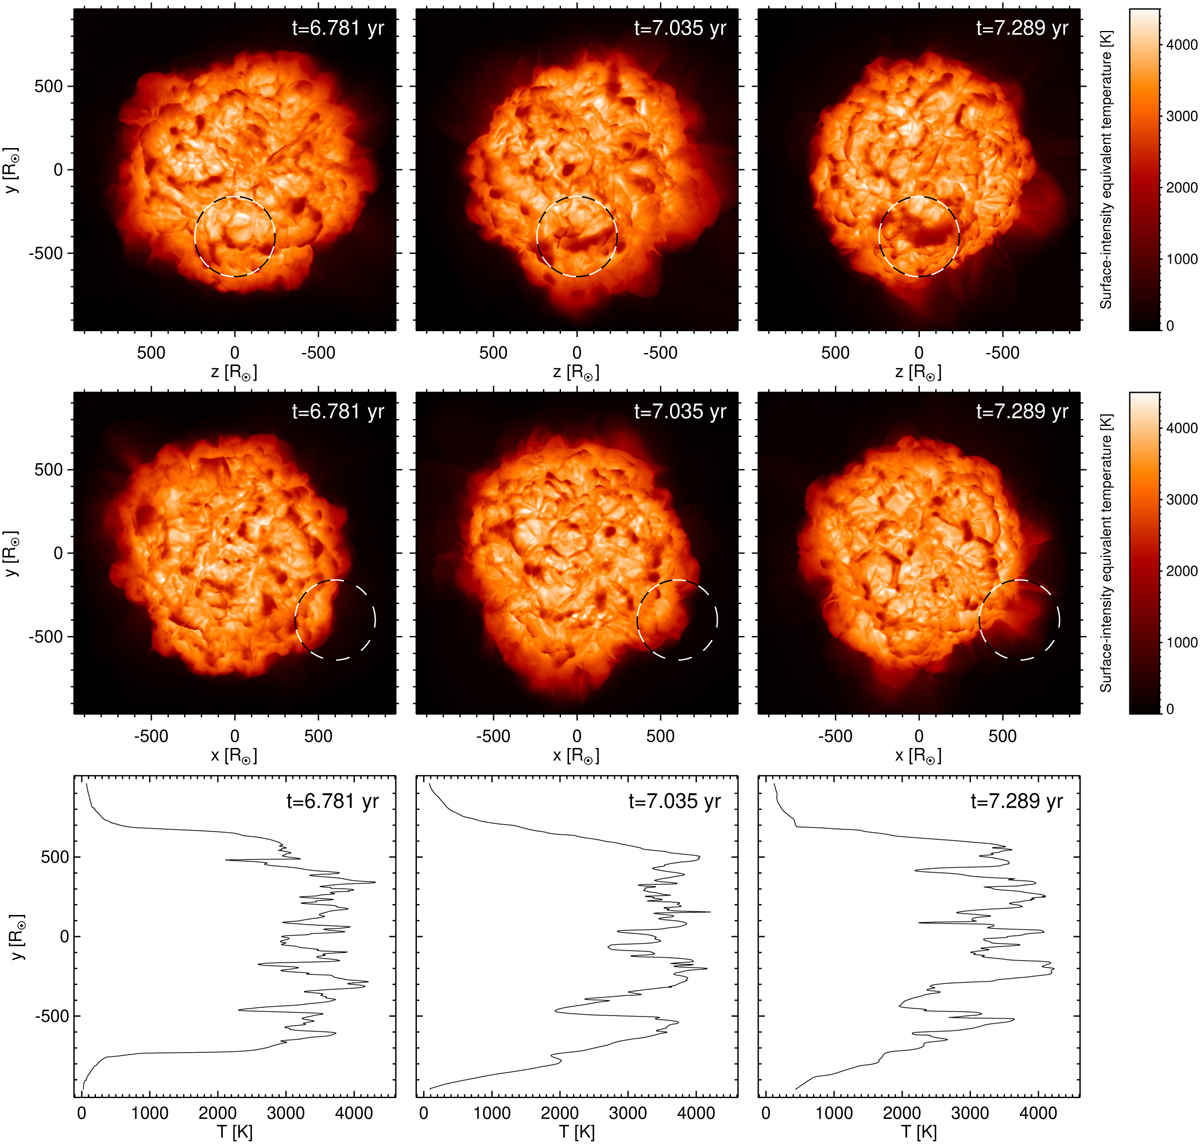
Time sequences of surface temperature data derived from the bolometric intensity of three snapshots of the 5 M⊙ model st35gm04n045. Top and center row: Temperature maps for two viewing directions. The geometrical axes differ between the rows. The top row corresponds to Fig. 2. The rotated view in the bottom row shows the object in the top row seen by an observer on the left. The cool material causing the dark horizontal patch developing on the lower hemisphere in the top row (at about x = 600 R⊙, y = −400 R⊙, z = 0) is seen from the side at 4 o’clock in the bottom row as a narrower emitting feature, marked by a dashed-line circle. It corresponds to the cross sections in Fig. 4. Bottom row: Central vertical (z = 0; x is the viewing direction) cuts through the temperature maps in the top row. The dark horizontal patch developing in that sequence produces the extended temperature minimum with values around T = 2000 K at about y = −400 R⊙, here.
Current usage metrics show cumulative count of Article Views (full-text article views including HTML views, PDF and ePub downloads, according to the available data) and Abstracts Views on Vision4Press platform.
Data correspond to usage on the plateform after 2015. The current usage metrics is available 48-96 hours after online publication and is updated daily on week days.
Initial download of the metrics may take a while.