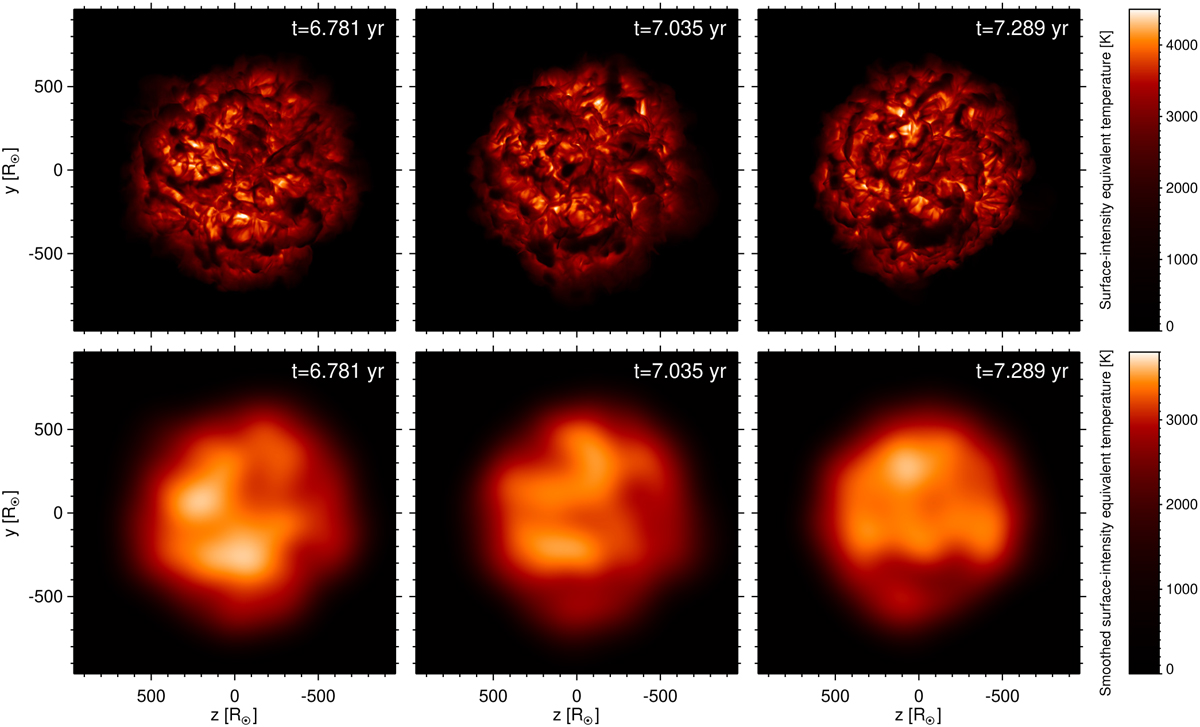
Fig. 2
Download original image
Time sequence of bolometric intensity of three snapshots of the 5 M⊙ model st35gm04n045 in original resolution (top row) and blurred by a Gaussian (σ = 30 px ≈ 91 R⊙, bottom row) with an adjusted color scale. We focus our analysis on the dark curved horizontal patch developing on the lower hemisphere of the stellar disc (the dark feature centered around y = −400 R⊙, z = 0 in the top right frame).
Current usage metrics show cumulative count of Article Views (full-text article views including HTML views, PDF and ePub downloads, according to the available data) and Abstracts Views on Vision4Press platform.
Data correspond to usage on the plateform after 2015. The current usage metrics is available 48-96 hours after online publication and is updated daily on week days.
Initial download of the metrics may take a while.