Fig. 14
Download original image
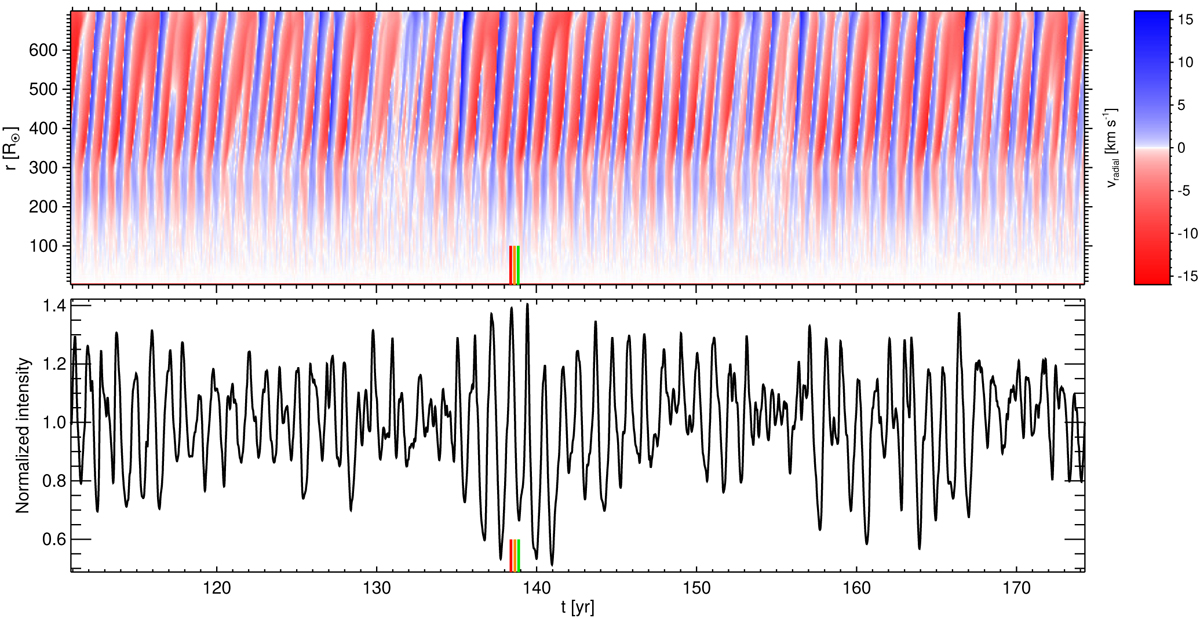
Temporal behavior of radial velocity and intensity of the 1 M⊙ model st28gm05n056. Top panel: Spherical averages of radial velocity as a function of radial distance and time. Bottom panel: Normalized intensity (luminosity seen by an observer) corresponding to the view in Fig. 13. The colored vertical lines (red, orange, green) at about t = 138 yr mark the instants selected for that figure. The timer for this model does not start at zero but at about t = 111 yr.
Current usage metrics show cumulative count of Article Views (full-text article views including HTML views, PDF and ePub downloads, according to the available data) and Abstracts Views on Vision4Press platform.
Data correspond to usage on the plateform after 2015. The current usage metrics is available 48-96 hours after online publication and is updated daily on week days.
Initial download of the metrics may take a while.