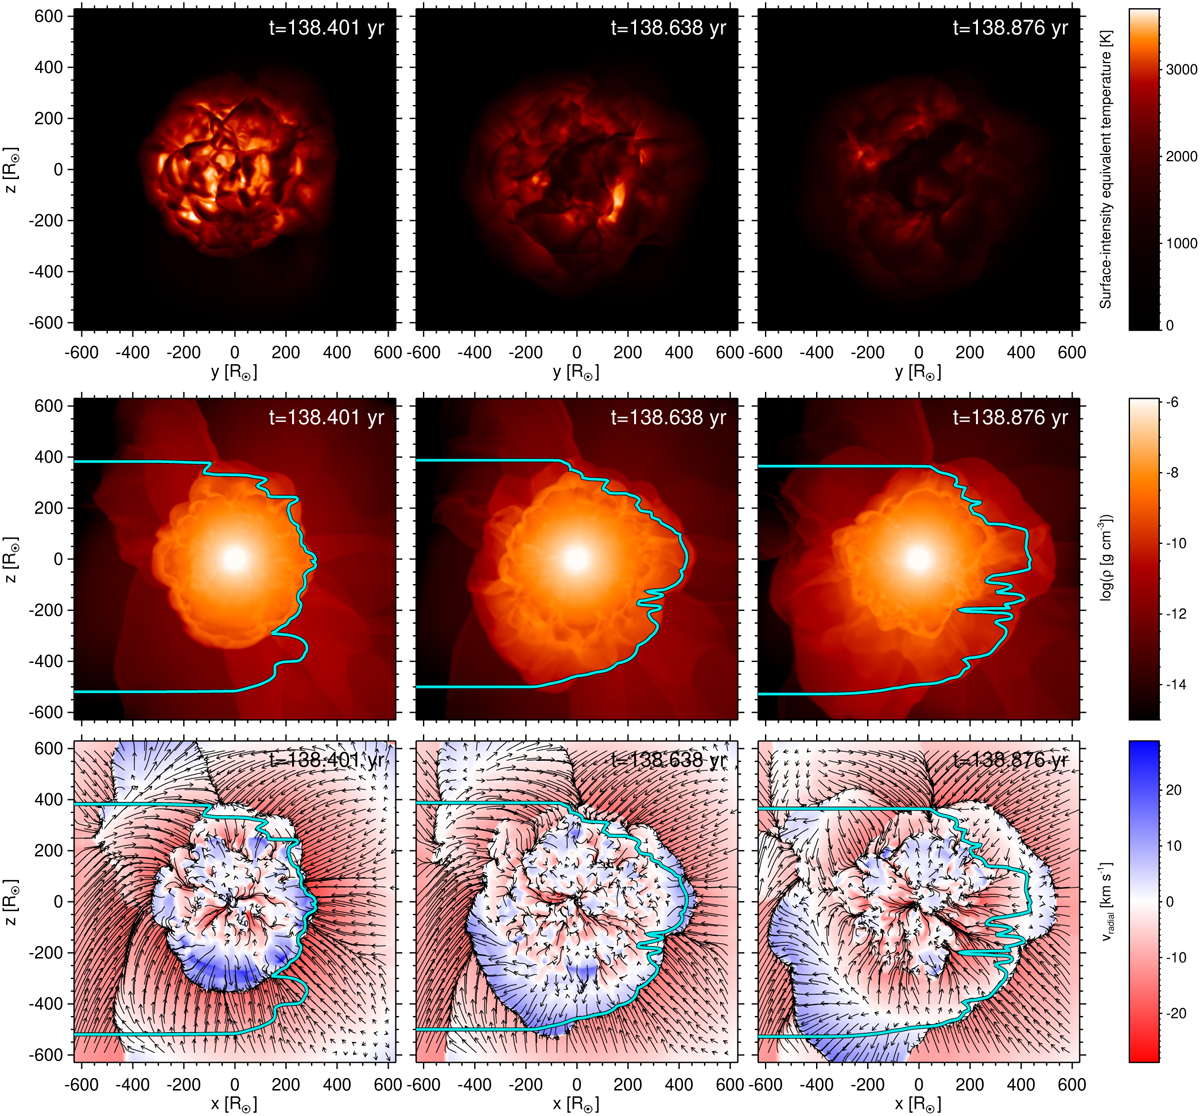
Fig. 13
Download original image
Time sequence of bolometric intensity in original resolution (top row) and a cross section though the logarithm of density (middle row), and the radial velocity with overlaid pseudo-streamlines (bottom row) of three snapshots of the 1 M⊙ model st28gm05n056. The cyan contour line indicates optical depth unity (τRoss = 1) for an observer located to the right, corresponding to the viewing direction in the top-row images.
Current usage metrics show cumulative count of Article Views (full-text article views including HTML views, PDF and ePub downloads, according to the available data) and Abstracts Views on Vision4Press platform.
Data correspond to usage on the plateform after 2015. The current usage metrics is available 48-96 hours after online publication and is updated daily on week days.
Initial download of the metrics may take a while.