Fig. 11
Download original image
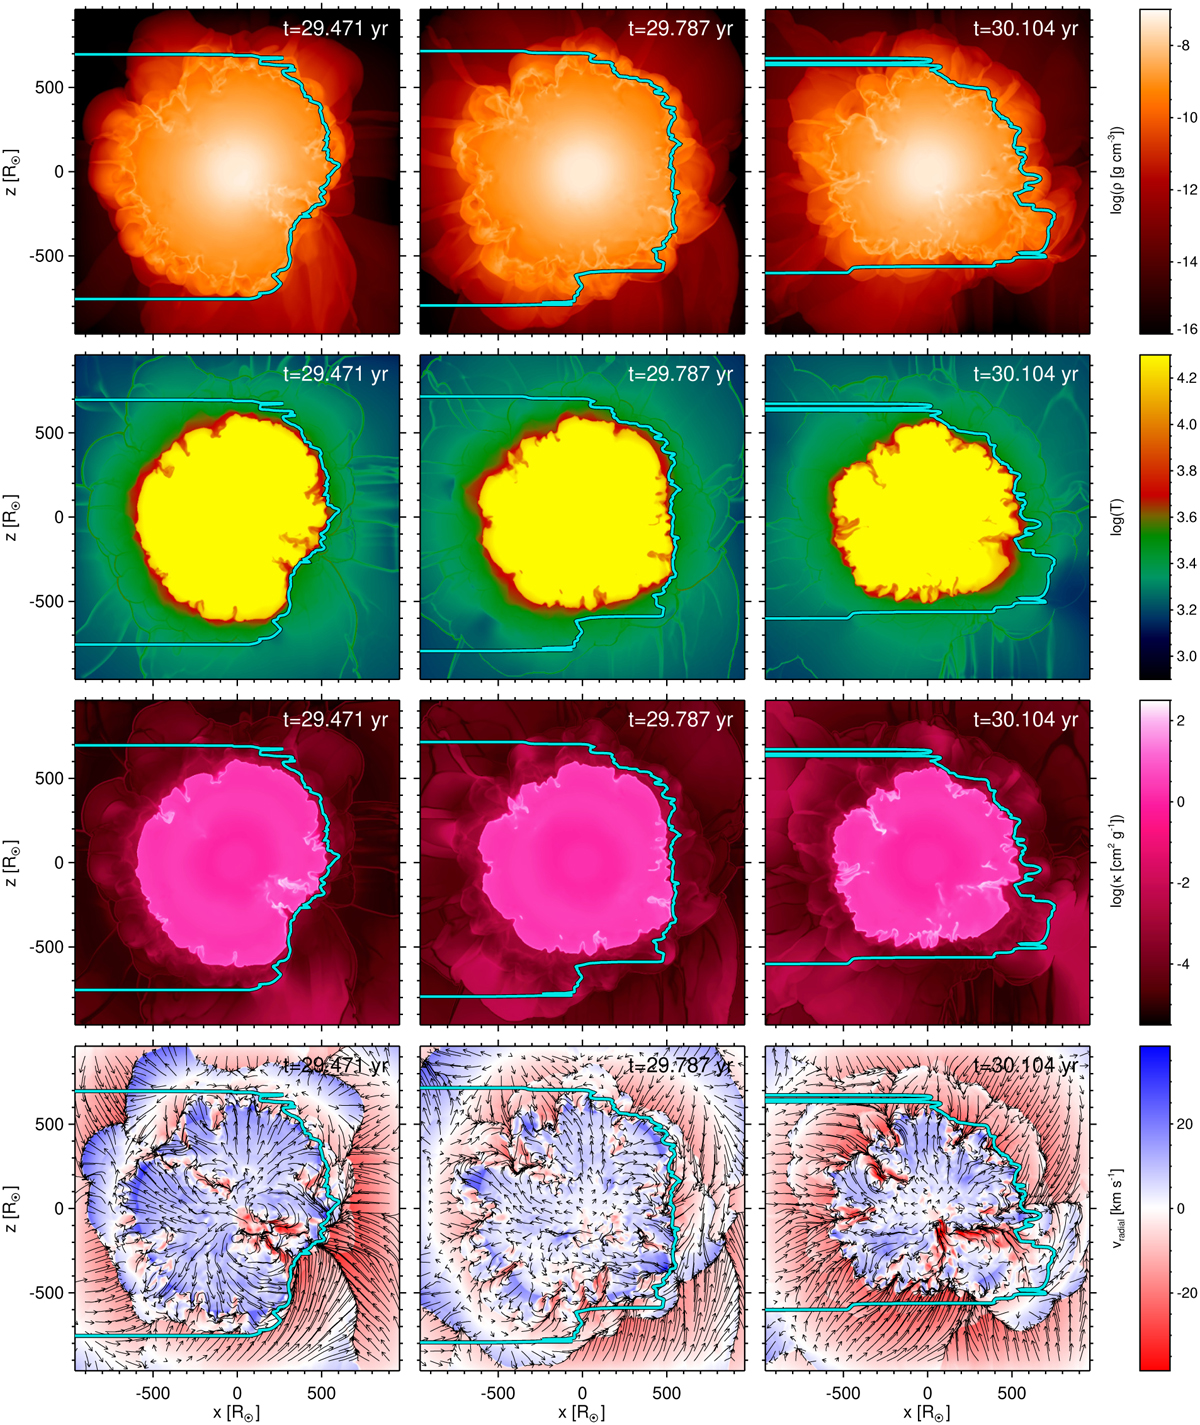
Time sequences of cross sections through the center of the 5 M⊙ model st35gm04n048 showing the logarithm of density, the logarithm of temperature (restricted to values below T = 20 000 K), the logarithm of opacity (per gram), and the radial velocity with overlaid pseudo-streamlines. The cyan contour line indicates optical depth unity (τRoss = 1) for an observer on the right, corresponding to the viewing direction shown in Fig. 10.
Current usage metrics show cumulative count of Article Views (full-text article views including HTML views, PDF and ePub downloads, according to the available data) and Abstracts Views on Vision4Press platform.
Data correspond to usage on the plateform after 2015. The current usage metrics is available 48-96 hours after online publication and is updated daily on week days.
Initial download of the metrics may take a while.