Fig. 1
Download original image
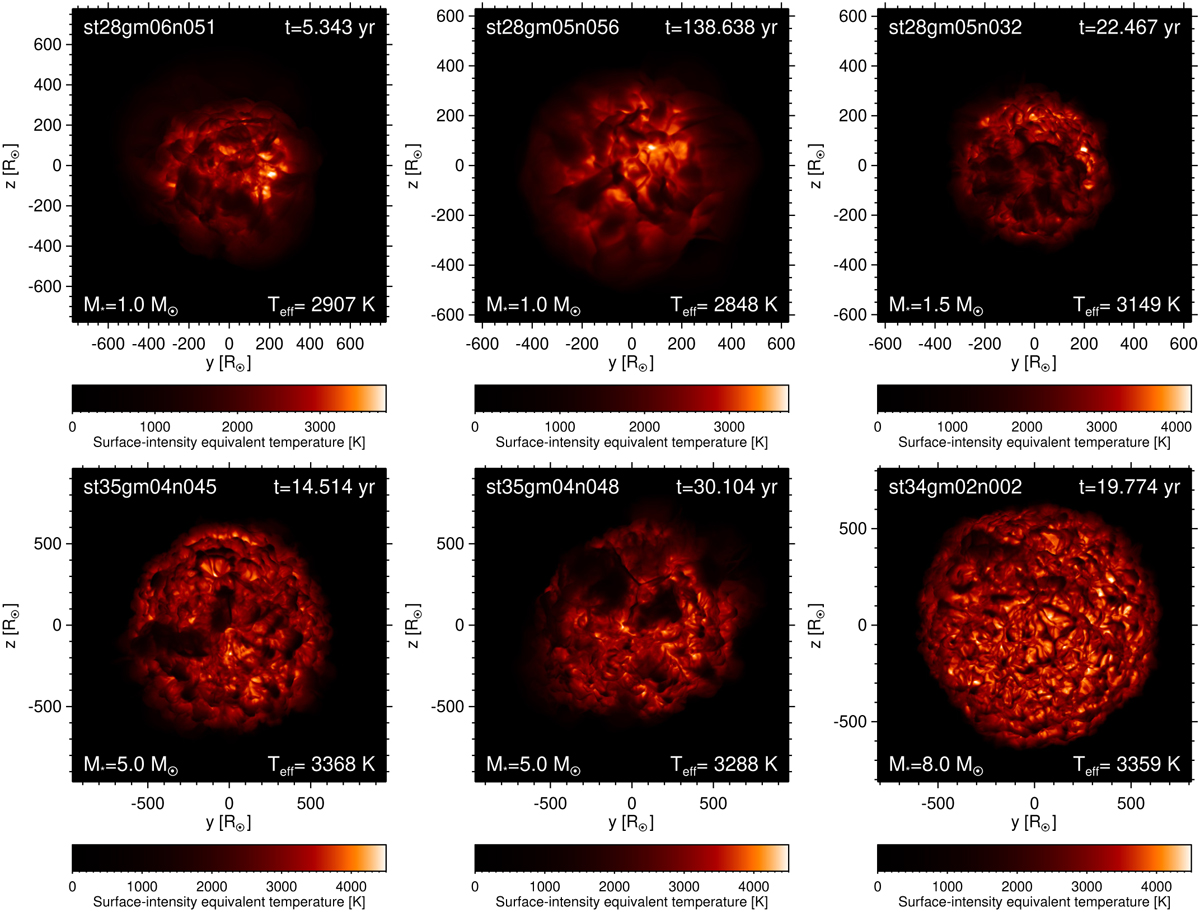
Examples of dark patches forming in models with different stellar parameters. Shown are bolometric intensity maps of the models in Table 1. Top row (AGB stars): st28gm06n051 (M⋆ = 1 M⊙, Teff ≈ 2907 K), st28gm06n056 (M⋆ = 1 M⊙, Teff ≈ 2848 K; opposite side of model shown in Fig. 13), st28gm05n032 (M⋆ = 1.5 M⊙, Teff ≈ 3149 K). Bottom row (RSG stars): st35gm04n045 (M⋆ = 5 M⊙, Teff ≈ 3368 K; different snapshot of our standard model shown in Fig. 2), st35gm04n048 (M⋆ = 5 M⊙, Teff ≈ 3288 K; opposite side of model shown in Fig. 10), st34gm02n002 (M⋆ = 8 M⊙, Teff ≈ 3359 K).
Current usage metrics show cumulative count of Article Views (full-text article views including HTML views, PDF and ePub downloads, according to the available data) and Abstracts Views on Vision4Press platform.
Data correspond to usage on the plateform after 2015. The current usage metrics is available 48-96 hours after online publication and is updated daily on week days.
Initial download of the metrics may take a while.