Fig. 5.
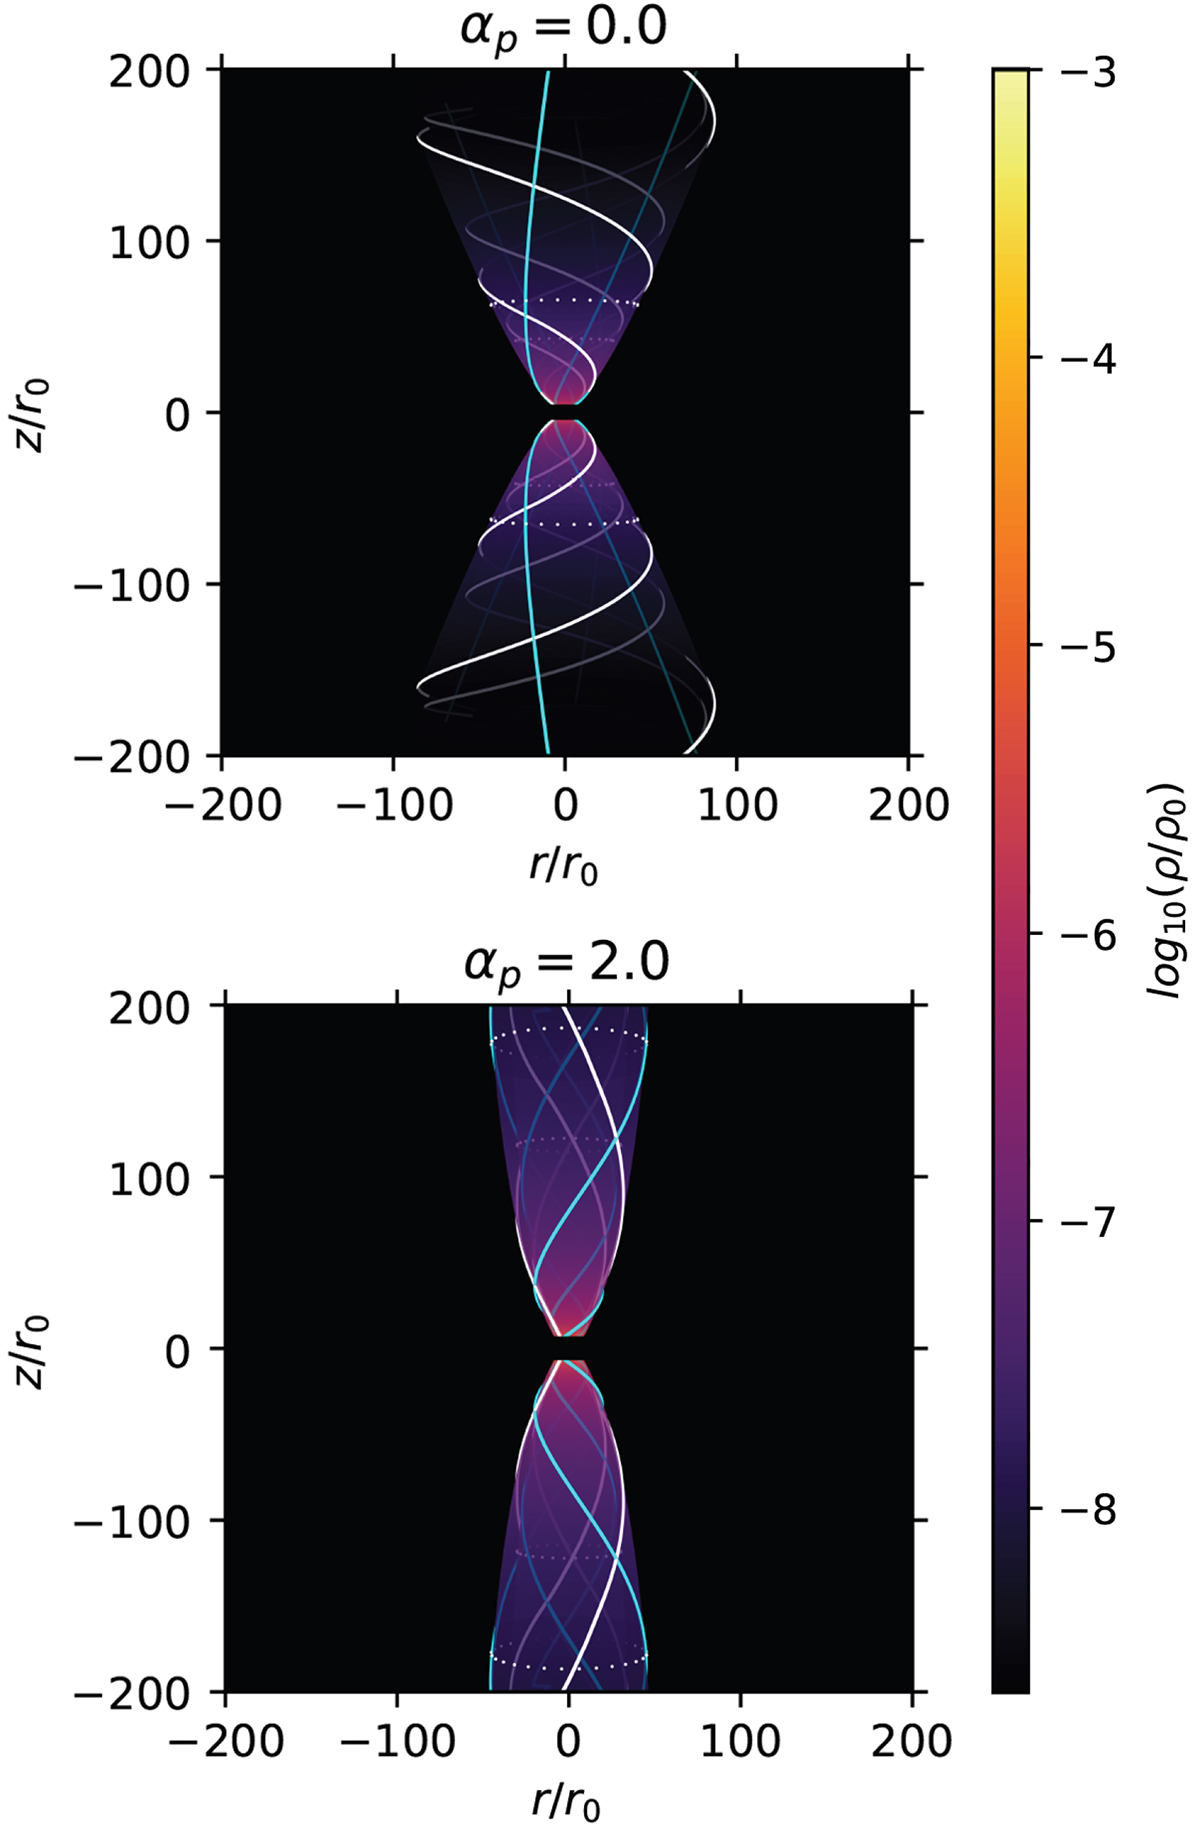
Download original image
3D view of the JED solutions shown in Fig. 2 with the same ejection index (ξ = 3 × 10⁻³), obtained with our fiducial set (ϵ = 0.1, αm = 𝒫m = χm = 1), without (αP = 0, μ = 0.6) and with (αP = 2, μ = 3.9) turbulent magnetic pressure. The color represents the logarithm of the density normalized to its midplane value, the white lines show the magnetic field lines and the blue lines show the streamlines along the same magnetic surfaces, anchored at ro = 2 and ro = 3. The white dotted lines show the position of the Alfvén point on these surfaces.
Current usage metrics show cumulative count of Article Views (full-text article views including HTML views, PDF and ePub downloads, according to the available data) and Abstracts Views on Vision4Press platform.
Data correspond to usage on the plateform after 2015. The current usage metrics is available 48-96 hours after online publication and is updated daily on week days.
Initial download of the metrics may take a while.