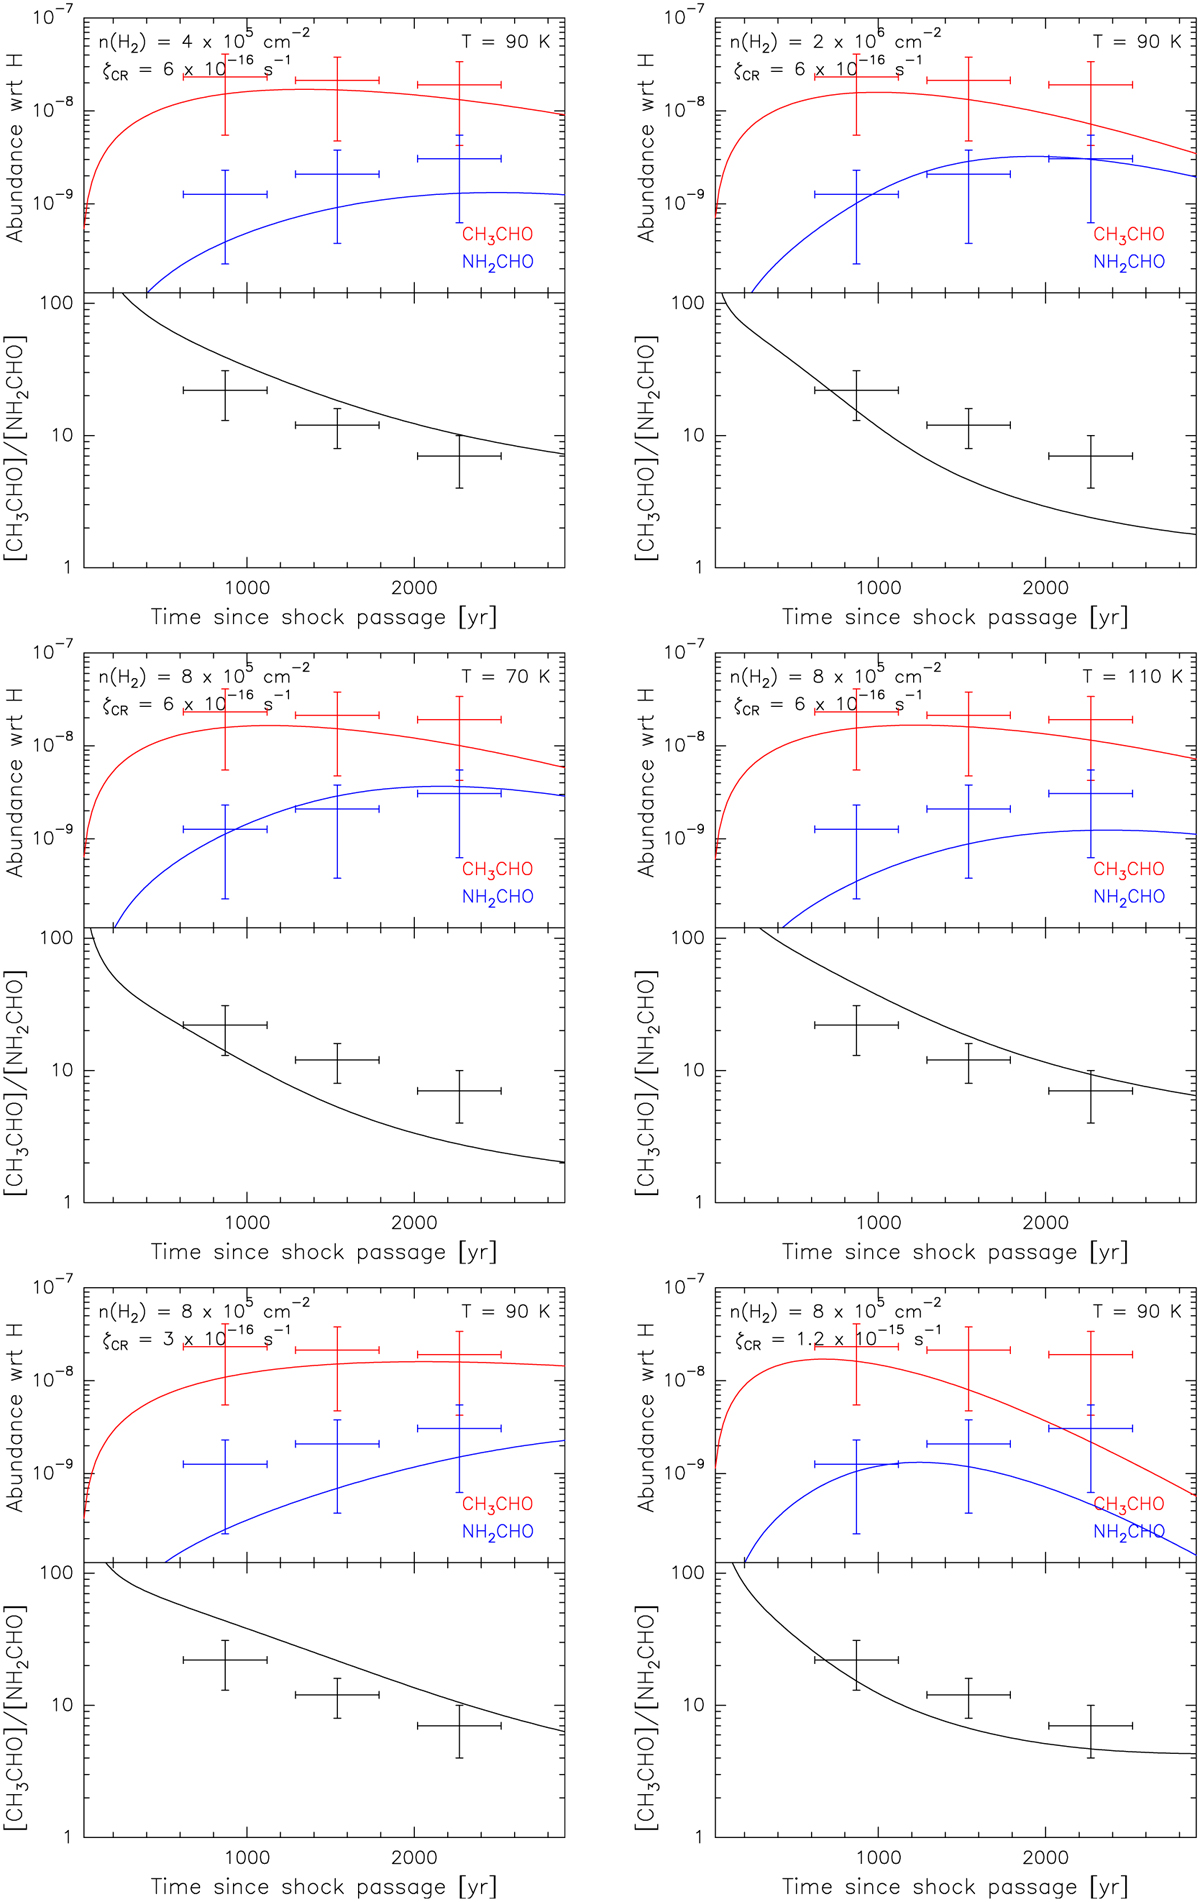
Fig. C.1
Download original image
Each double-panel box plots the CH3CHO and NH2CHO abundances (top panel) and their ratio (bottom panel) predicted by the gas-phase chemistry model for varying physical parameter values, and for injected molecular abundances equal to those that best represent our data (see Fig. 4). The top boxes vary the density, the central boxes vary the gas temperature, and the bottom boxes vary the CR ionisation rate. Measurement points in B0, B1, and B2 are shown as crosses whose vertical lengths correspond to the measured abundance (ratio) uncertainties (see Table 2), and whose horizontal lengths account for a 500-yr uncertainty in the post-shock time as derived by Podio et al. (2016).
Current usage metrics show cumulative count of Article Views (full-text article views including HTML views, PDF and ePub downloads, according to the available data) and Abstracts Views on Vision4Press platform.
Data correspond to usage on the plateform after 2015. The current usage metrics is available 48-96 hours after online publication and is updated daily on week days.
Initial download of the metrics may take a while.