Open Access
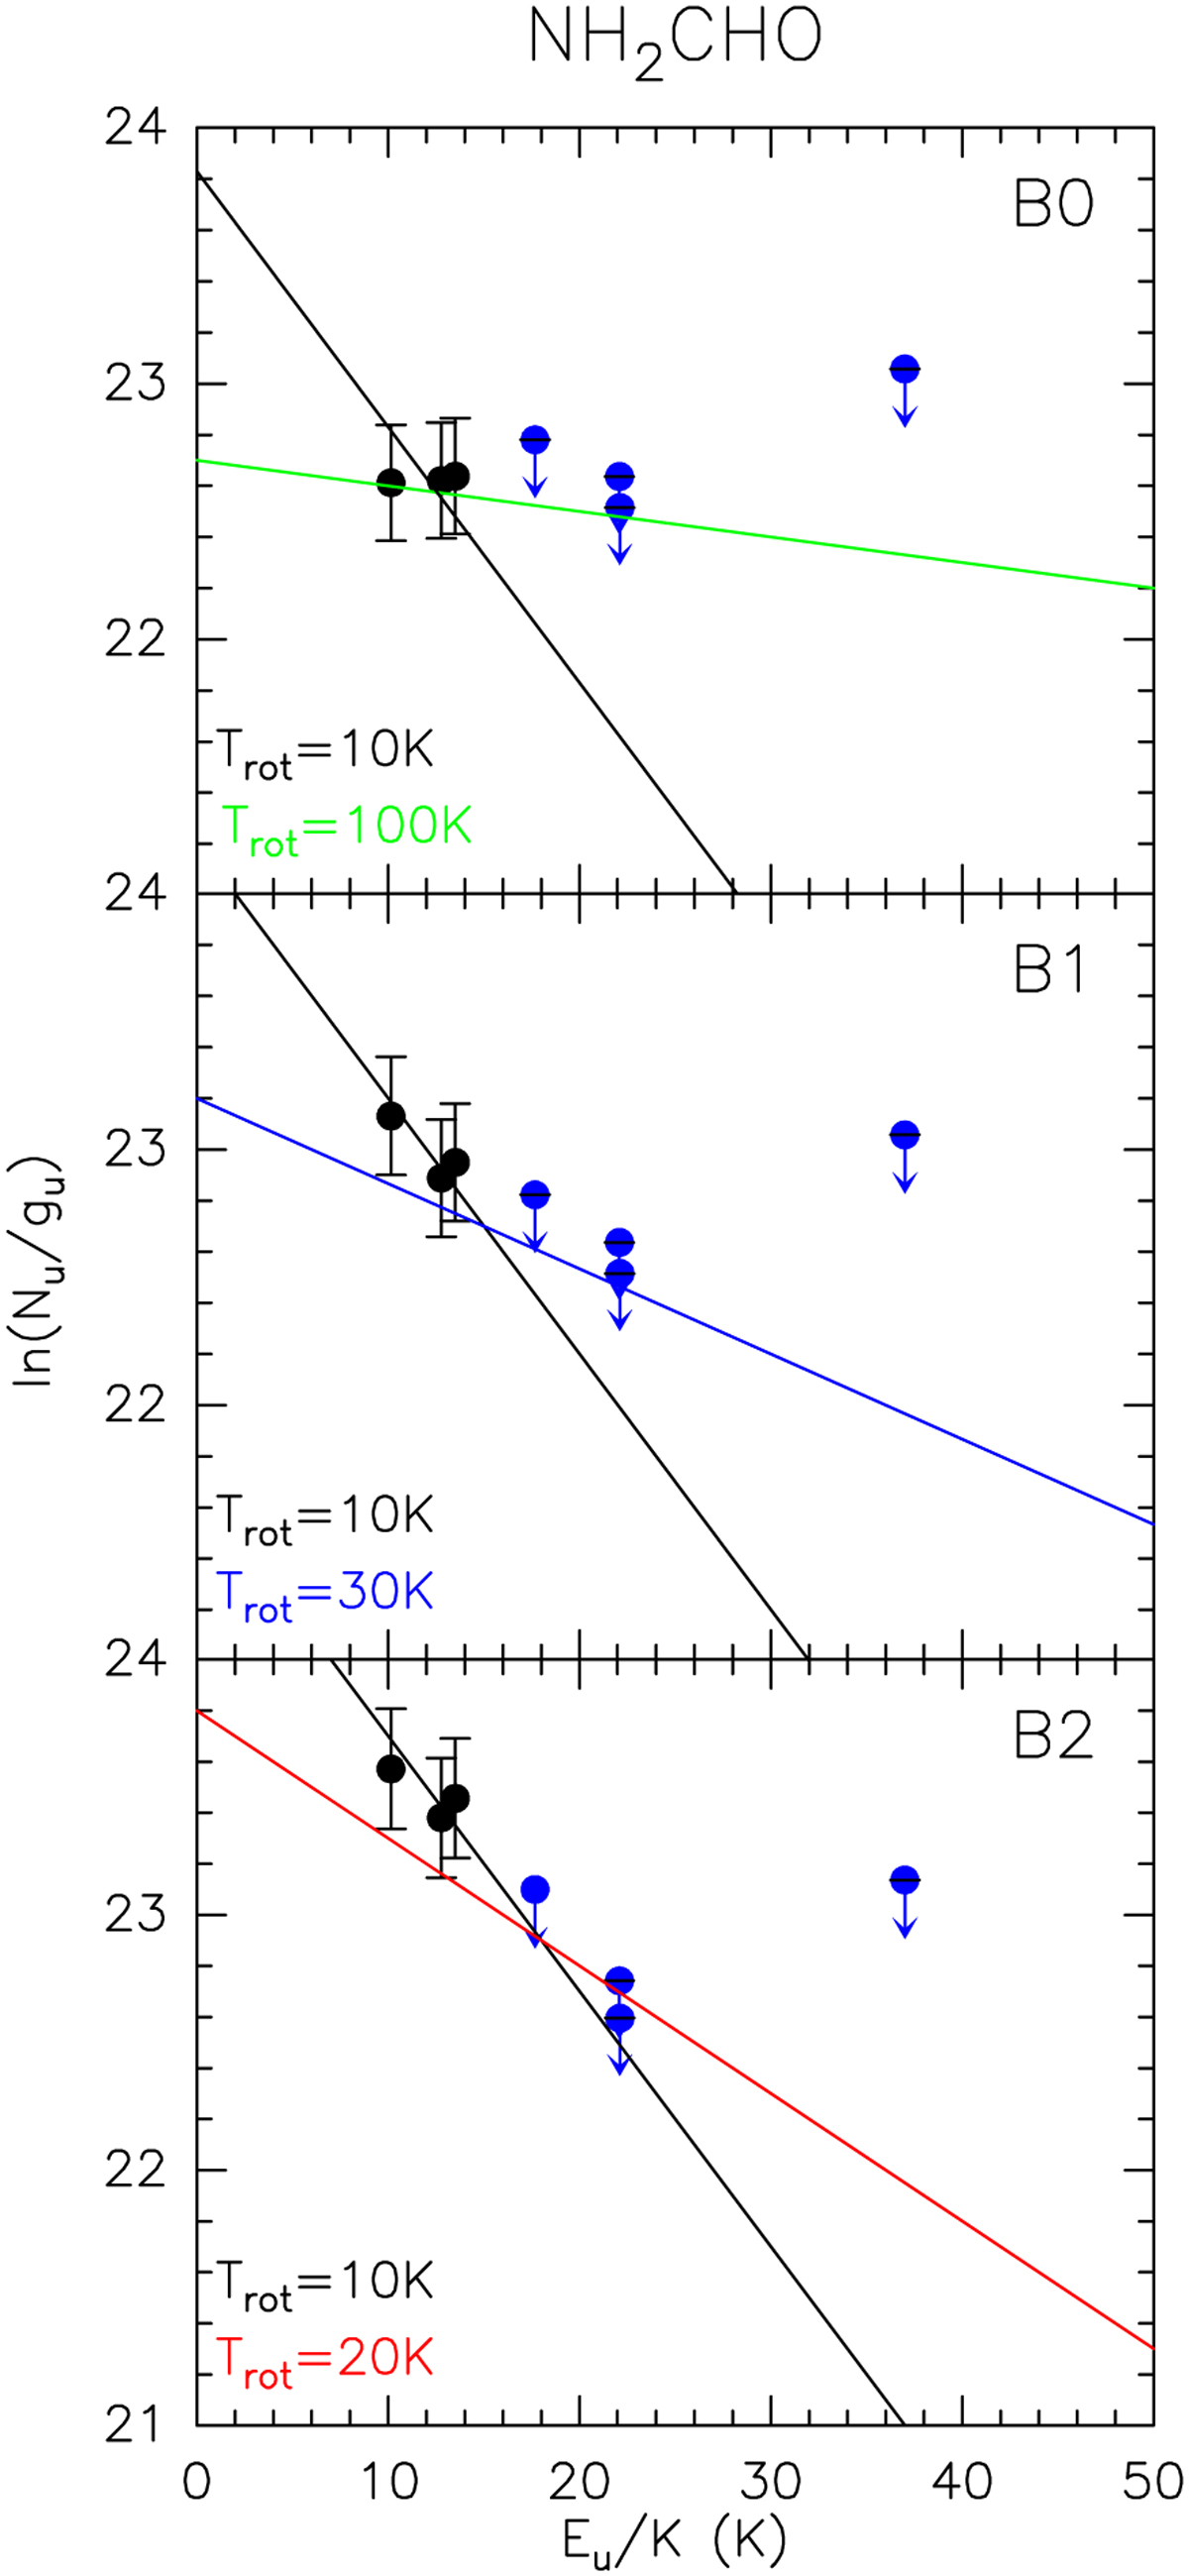
Fig. B.1
Download original image
Rotational diagrams of NH2CHO for BO, B1, and B2, including 3σ upper limits of undetected transitions in blue. Several curves corresponding to different values of Trot are plotted for reference only and do not correspond to actual fits to the data.
Current usage metrics show cumulative count of Article Views (full-text article views including HTML views, PDF and ePub downloads, according to the available data) and Abstracts Views on Vision4Press platform.
Data correspond to usage on the plateform after 2015. The current usage metrics is available 48-96 hours after online publication and is updated daily on week days.
Initial download of the metrics may take a while.