Fig. 3
Download original image
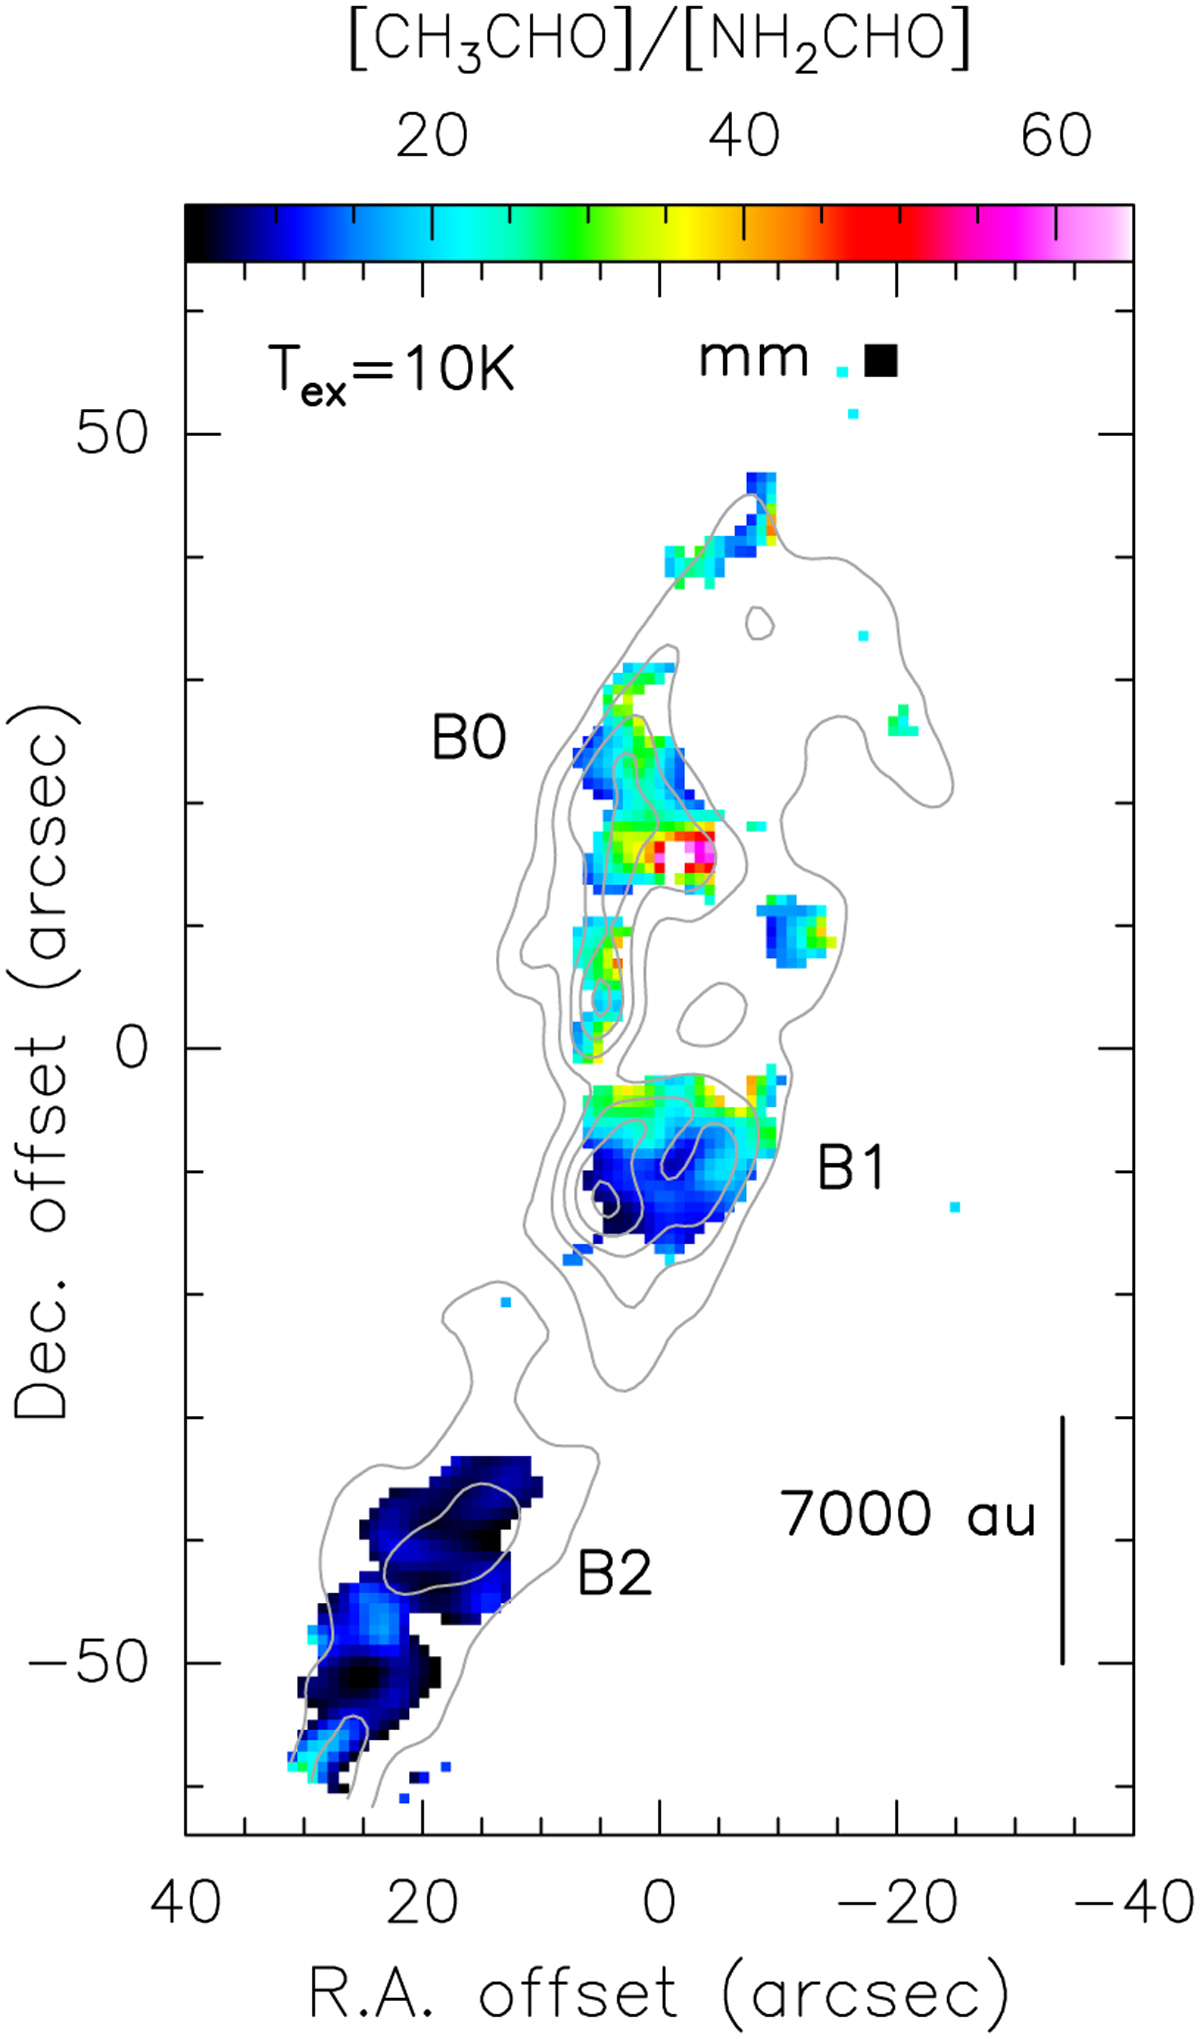
CH3CHO/NH2CHO column-density-ratio map along the L1157 southern outflow, assuming Tex = 10 K across the entire outflow lobe. Regions where the emission is below 3σ are masked out (the corresponding 1σ RMS values are given in the caption of Fig. 1). The unitless colour scale is displayed at the top of the panel. Grey contours corresponding to the CS(2−1) velocity-integrated map are overlaid for reference, starting at 50σ and increasing in steps of 150σ. The black square at the top of the map marks the position of L1157-mm (Bachiller et al. 2001; Lefloch et al. 2017).
Current usage metrics show cumulative count of Article Views (full-text article views including HTML views, PDF and ePub downloads, according to the available data) and Abstracts Views on Vision4Press platform.
Data correspond to usage on the plateform after 2015. The current usage metrics is available 48-96 hours after online publication and is updated daily on week days.
Initial download of the metrics may take a while.