Open Access
Fig. 2
Download original image
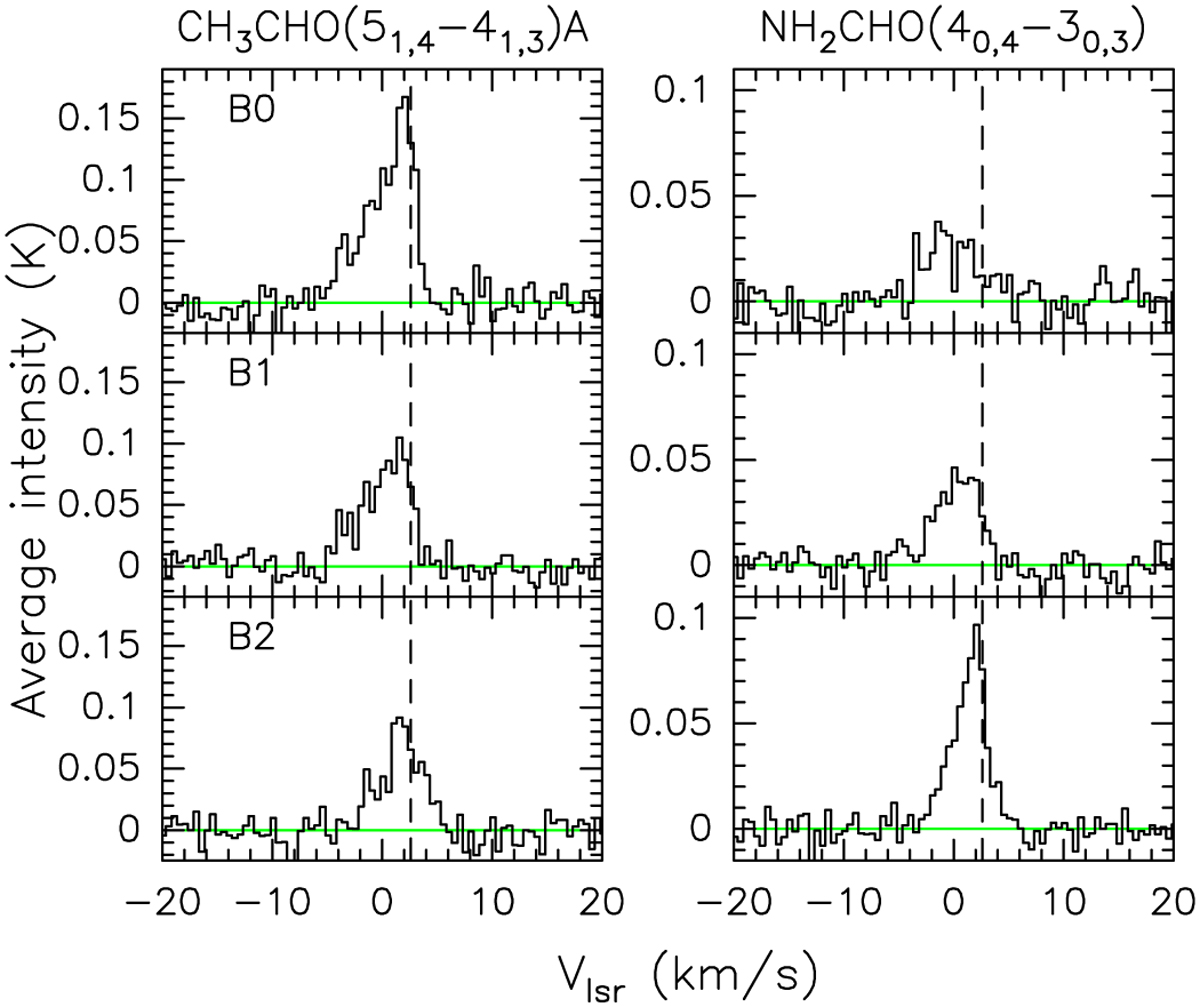
Spectra of CH3CHO(51,4−41,3)A and NH2CHO(40,4−30,3) averaged over the three polygons defined in Fig. 1 for the shocked regions B0, B1, and B2. The dashed vertical line and the green horizontal line mark, respectively, the systemic velocity of L1157-mm (Vlsr = 2.6 km s−1) and the zero-intensity level of each spectrum.
Current usage metrics show cumulative count of Article Views (full-text article views including HTML views, PDF and ePub downloads, according to the available data) and Abstracts Views on Vision4Press platform.
Data correspond to usage on the plateform after 2015. The current usage metrics is available 48-96 hours after online publication and is updated daily on week days.
Initial download of the metrics may take a while.