Fig. 1
Download original image
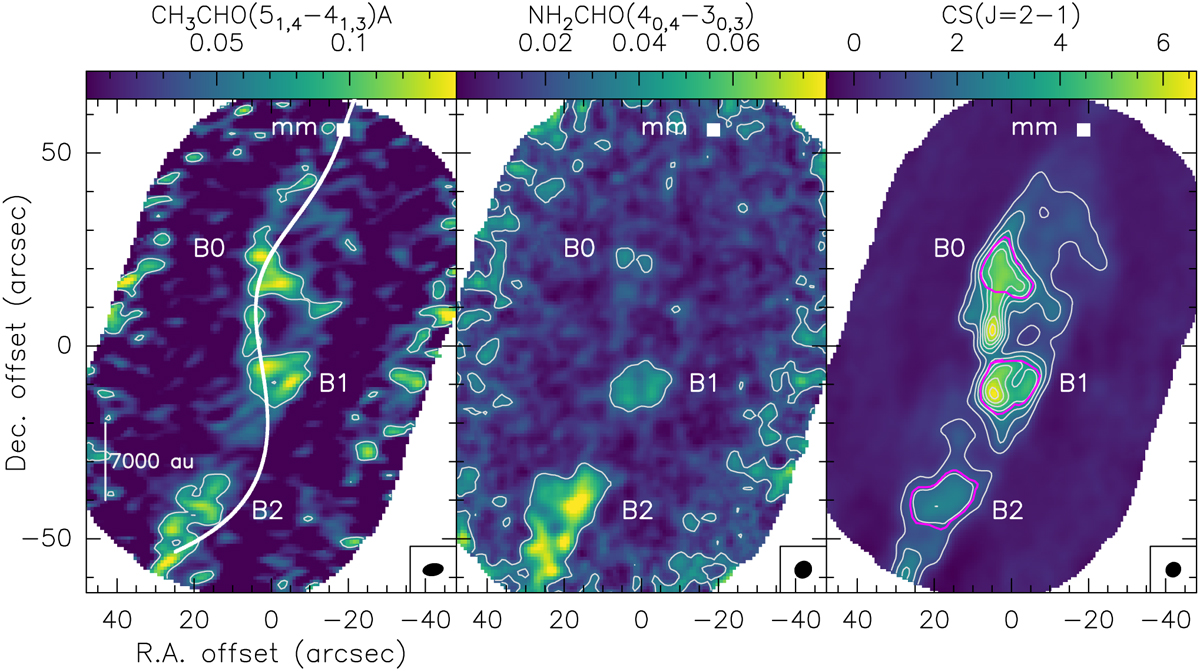
Velocity-integrated line maps of CH3CHO(51,4−41,3)A (left), NH2CHO(40,4−30,3) (centre), and CS(J=2−1) (right) along the L1157 southern outflow. The colour scale is displayed at the top of each panel in units of Jybeam−1 km s−1. For CH3 CHO and NH2CHO, the 4σ contours are displayed in grey, with 1σ values being 15 and 7 mJy beam−1 km s−1, respectively. For CS, grey contours start at 50σ and increase in steps of 100σ, with 1σ = 18 mJy beam−1 km s−1. This map has been used to define the three polygons B0, B1, and B2 (magenta), which are used to derive column densities. The (0″,0″) position corresponds to RA(J2000) = 20h39m09.635s, Dec(J2000) = 68°01′ 19.80″. The synthesised beams are depicted in the lower-right corner of each panel. The precession model computed by Podio et al. (2016) is marked in the left panel (white line). The white squares at the top of each panel correspond to the position of L1157-mm, the protobinary driving the outflow (Bachiller et al. 2001; Lefloch et al. 2017).
Current usage metrics show cumulative count of Article Views (full-text article views including HTML views, PDF and ePub downloads, according to the available data) and Abstracts Views on Vision4Press platform.
Data correspond to usage on the plateform after 2015. The current usage metrics is available 48-96 hours after online publication and is updated daily on week days.
Initial download of the metrics may take a while.