Fig. 5.
Download original image
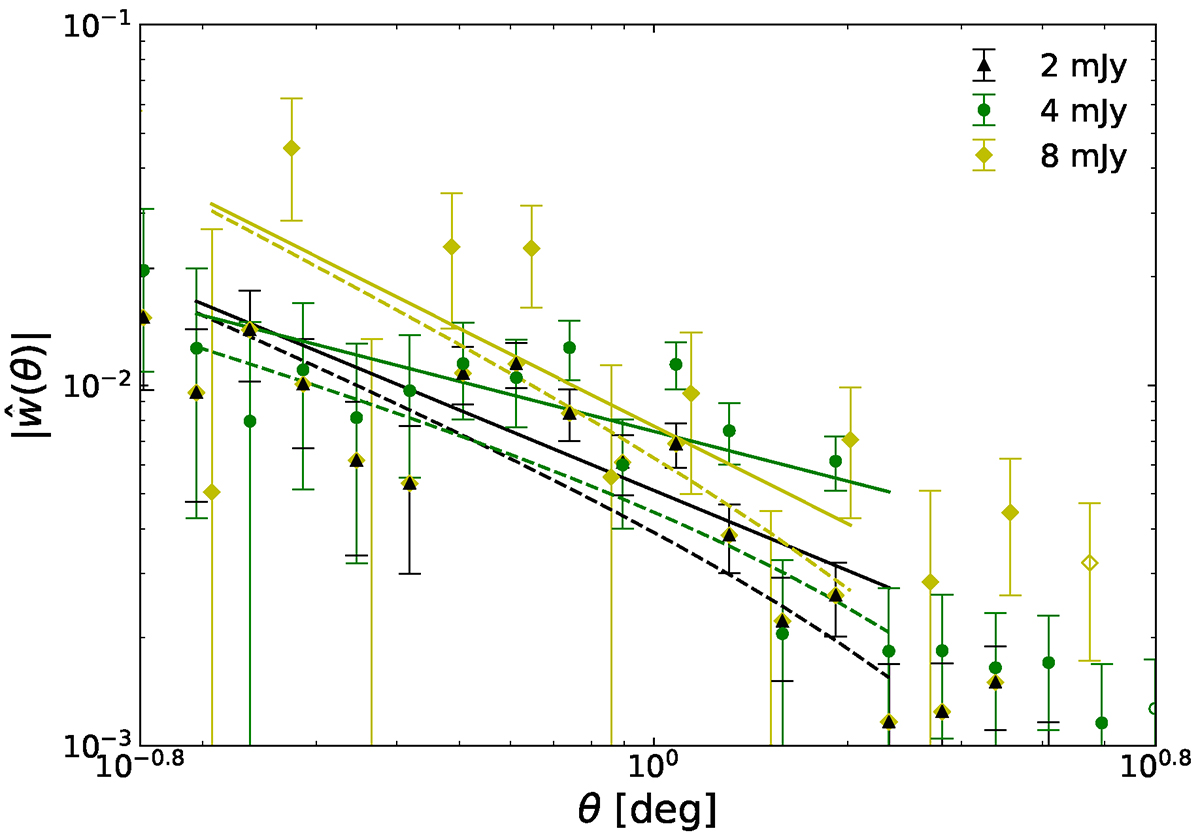
Absolute value of two-point angular correlation function for different fluxes and their corresponding fit lines (solid lines show the best-fit power-law and dashed lines show the fits after including the effect of the integral constraint) over the fit-range 0.2 deg < θ < 2 deg with same colour codes. Open symbols for data points indicate negative values of w(θ). Data and fits for 8 mJy are new, for 2 and 4 mJy we take them from Siewert et al. (2020).
Current usage metrics show cumulative count of Article Views (full-text article views including HTML views, PDF and ePub downloads, according to the available data) and Abstracts Views on Vision4Press platform.
Data correspond to usage on the plateform after 2015. The current usage metrics is available 48-96 hours after online publication and is updated daily on week days.
Initial download of the metrics may take a while.