Fig. 6.
Download original image
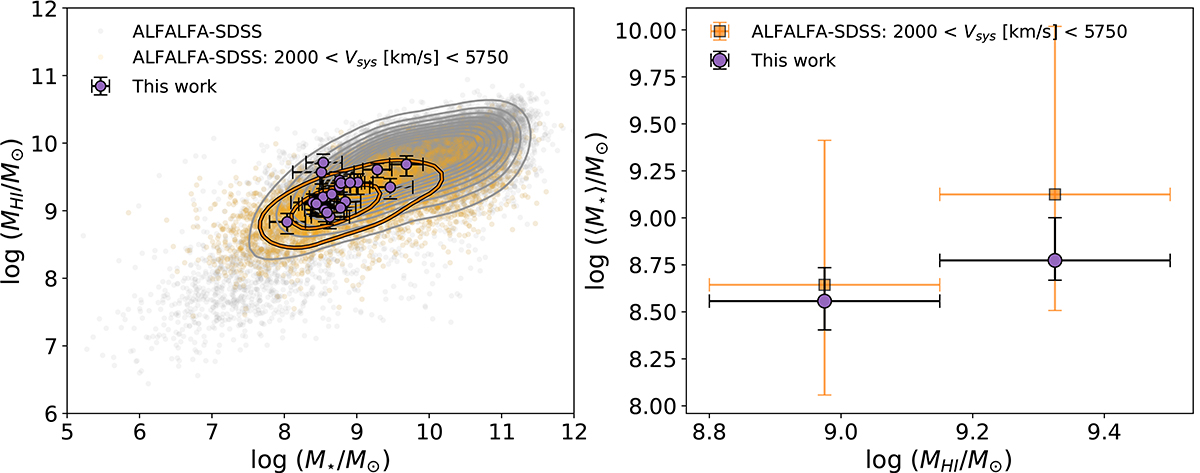
Comparison of H I and stellar masses between our and the ALFALFA sample. Left: MH I − M⋆ relation. Our sample is shown as purple circles, the total ALFALFA-SDSS sample is given by gray points and contours, and the volume limited subsample with 2000 < Vsys[km s−1] < 5750 is given by orange points and contours. Right: Median values of M⋆ for MH I bins between 8.8 < log (MH I/M⊙) < 9.5. Our sample is represented by purple circles, while the volume limited subsample from ALFALFA-SDSS is represented by orange squares.
Current usage metrics show cumulative count of Article Views (full-text article views including HTML views, PDF and ePub downloads, according to the available data) and Abstracts Views on Vision4Press platform.
Data correspond to usage on the plateform after 2015. The current usage metrics is available 48-96 hours after online publication and is updated daily on week days.
Initial download of the metrics may take a while.